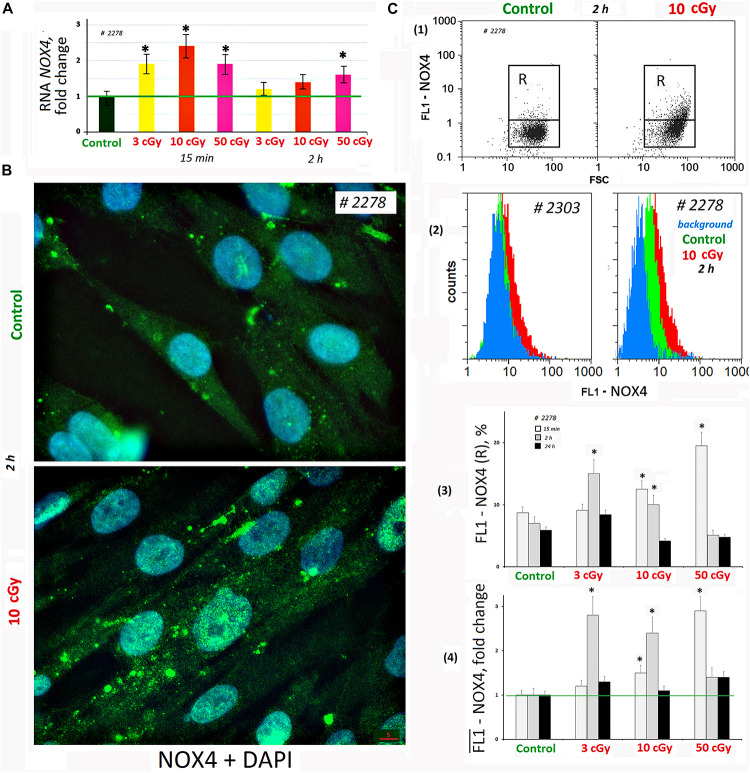
FIGURE 3.
LDIR induce expression of NOX4 in MSCs. (A) Quantitative reverse transcriptase–polymerase chain reaction. NOX4 RNA levels changes in treated cells (15 min or 2 h after LDIR) compared to control. Average values and SD are given for three experiments. Reference gene TBP. *p < 0.001 (U test). (B) Fluorescence microscopy. Localization of FITC-labeled antibody against NOX4 in the irradiated MSC (10 cGy, 2 h after LDIR) and control MSC. (C) FACS. (1) Plots: FL1-NOX4 versus SSC. R: gated area, cells with an increased NOX4 expression. (2) The distribution of #2278 and #2303 MSCs (10 cGy, 2 h after LDIR) with varying FL1-NOX4 signal. To quantify the background fluorescence, we stained a portion of the cells with secondary FITC-conjugated antibodies only (blue color). (3) The content of the cells with an increased level of NOX4 expression (gate R). (4) Median signals for FL1–NOX4. Signals are normalized to control values. Average values and SD are given for three experiments. *p < 0.001 (U test).

