FIGURE 4.
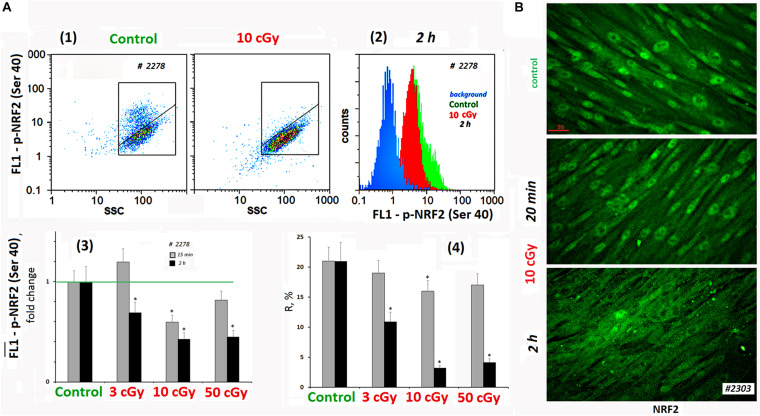
LDIR block activity of NRF2 in MSCs. (A) FACS. (1) Plots: FL1–p-NRF2(Ser40) versus SSC. R: gated area, cells with an increased level of p-NRF2(Ser40) expression. (2) The distribution of the MSCs (10 cGy, 2 h after LDIR) with varying FL1–p-NRF2(Ser 40) signal. To quantify the background fluorescence, we stained a portion of the cells with secondary FITC-conjugated antibodies only (blue color). (3) The content of the cells with an increased p-NRF2(Ser40) expression (gate R). (4) Median signals for FL1–p-NRF2 (Ser40). Average values and SD are given for three experiments. *p < 0.001 (U test). The time of cell cultivation after LDIR is shown in the figure. (B) Fluorescence microscopy. Localization of FITC-labeled antibody against NRF2 in the irradiated MSCs (10 cGy, 20 min or 2 h after LDIR) and control MSC. In the control MSCs and in the MSCs (10 cGy, 20 min), the protein NRF2 is located in the nucleus. In the MSCs (10 cGy, 2 h), the protein is located outside the nucleus.

