FIGURE 5.
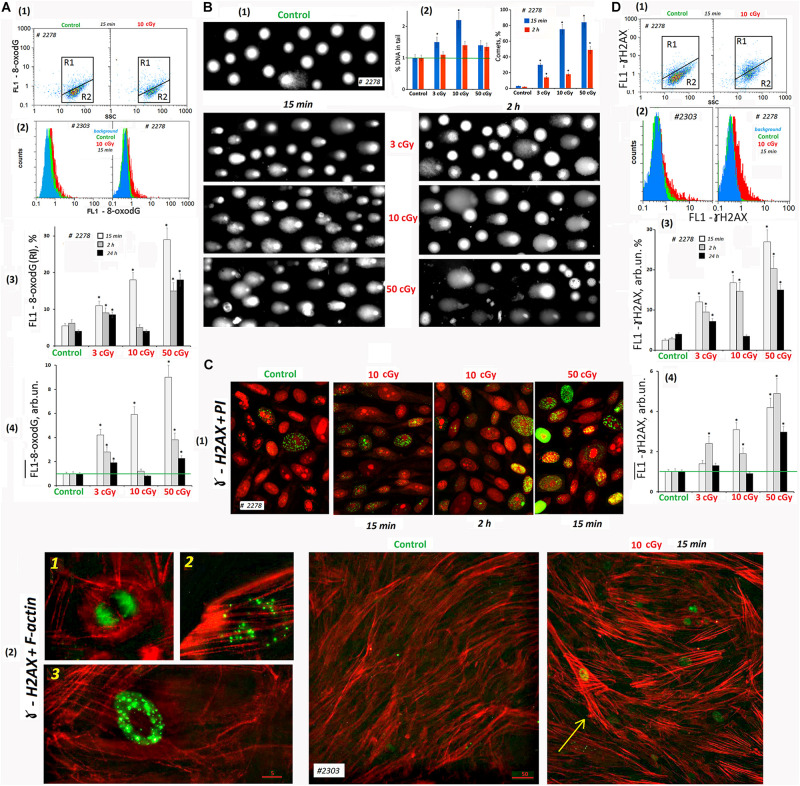
LDIR induce DNA damage and DNA breaks in MSCs. (A) FACS. Cell DNA oxidation (marker-8-oxodG). (1) Plots: FL1- 8-oxodG versus SSC. R1: gated area, cells with an increased level of 8-oxodG. (2) The distribution of #2278 and #2303 MSCs (10 cGy, 15 min after LDIR) with varying FL1–8-oxodG signal. Background fluorescence (blue color): the cells were stained with secondary FITC-conjugated antibodies only. (3) The content of the cells with an increased 8-oxodG (R1) level. (4) Median signals for FL1–8-oxodG. Average values and SD are given for three experiments. *p < 0.001 (U test). The time of cell cultivation after LDIR is shown in the figure. (B) Comet assay (alkaline agarose gel electrophoresis, stained with PI). Determination of the total DNA breaks level. (1) Gallery of comets in different cell populations. The photograph provides data from several images of comets gels. The cultivation times and radiation doses are shown in the figure. (2) Relative frequency of DNA percent distribution in the comet tail (left graph) and the number of comets in the cell populations (right graph). (C) Fluorescence microscopy. Determination of DSBs (ɣ-H2AX foci) level. (1) Gallery of photographs of cell nuclei (PI – red) with ɣ-foci (green) for different cell populations. The photograph provides the data from several images. The cultivation times and radiation doses are shown in the figure. (2) Photographs of the cells with ɣ-foci (green) for MSCs (control) and MSCs (10 cGy) populations. Rhodamine phalloidin was used to label cytoskeletal F-actin. 1, 2, and 3: Examples of the cells containing ɣ-foci. An arrow indicates the cell with DNA damage and increased F-actin levels. (D) FACS. Determination of DSBs (ɣ-H2AX foci) level. (1) Plots: FL1- ɣ-H2AX versus SSC. R1: gated area, cells with an increased ɣ-H2AX level. (2) The distribution of #2278 and #2303 MSCs (10 cGy, 15 min after LDIR) with varying FL1-ɣ-H2AX signal. Background fluorescence (blue color): the cells were stained with secondary FITC-conjugated antibodies only. (3) The content of the cells with an increased level of ɣ-H2AX (gate R1). (4) Median signals for FL1-ɣ-H2AX. Average values and SD are given for three experiments. *p < 0.001 (U test). The time of cell cultivation after LDIR is shown in the figure.

