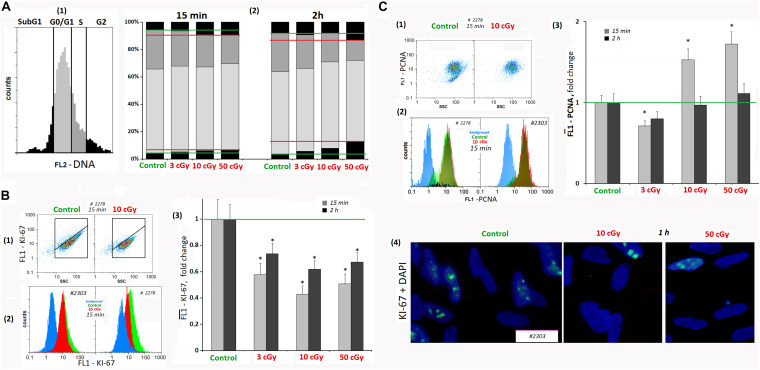
FIGURE 6.
LDIR induce cell cycle arrest in MSCs. (A) FACS. The DNA amount in the MSCs (cell nuclei staining with PI). (1 and 2) MSC fractions with the DNA amount corresponding to the Sub G1, G0/G1 -, S -, and G2/M cell cycle phases. The cultivation times and radiation doses are shown in the figure. (B) FACS (1–3). Cell nuclei staining with FITC-labeled antibody against KI-67. (1) Plots: FL1- KI-67 versus SSC. (2) The distribution of the MSCs (10 cGy, 15 min after LDIR) with varying FL1–KI-67 signal. (3) Median signals for FL1–KI-67. (4) Fluorescence microscopy. Localization of FITC-labeled antibody against KI-67 in the irradiated MSC (10 and 50 cGy) and MSC (C). Average values and SD are given for three experiments. *p < 0.001 (U test). (C) FACS. Cell nuclei staining with FITC-labeled antibody against PCN (A). (1) Plots: FL1- PCNA versus SSC. (2) The distribution of the MSCs (10 cGy) with varying FL1–PCNA signal. (3) Median PCNA signals.

