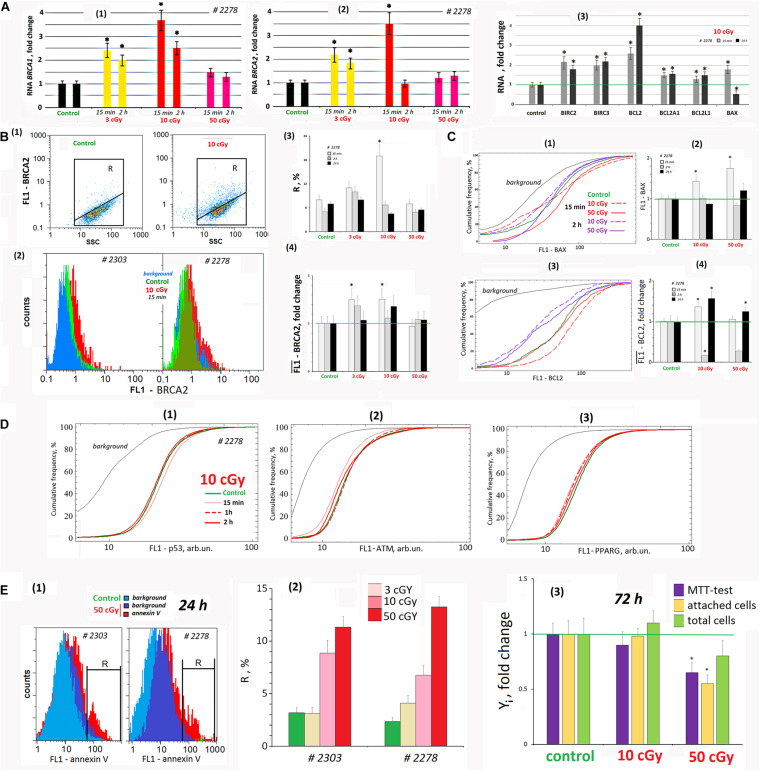
FIGURE 7.
LDIR affect the processes of apoptosis and repair in the cells. (A) Quantitative reverse transcriptase–polymerase chain reaction. (1) and (2) Changes in the levels of RNA BRCA1 and RNA BRCA2 in LDIR-treated cells compared to control (three biological replicates). The time of cell cultivation after LDIR is shown in the figure. (3) Proapoptotic gene BAX 1 RNA level and BIRC and BCL families antiapoptotic genes changes in the MSCs (10 cGy) compared to control (three biological replicates). Reference gene TBP. *p < 0.001 (U test). (B) FACS. BRCA2 protein level changes. (1) Plots: FL1- BRCA2 versus SSC. R: gated area, cells with an increased BRCA2 level. (2) MSCs (10 cGy, 15 min after LDIR) with varying FL1–BRCA2 signal distribution. (3) The content of the cells with an increased BRCA2 level. (4) Median FL1–BRCA2 signals. Average values and SD are given for three experiments. *p < 0.001 (U test). The time of cell cultivation after LDIR is shown in the figure. (C) FACS. (1) The cumulative distribution of the MSCs (10 and 50 cGy) with varying FL1–BAX1 signal. (2) Median signals for FL1–BAX1. (3) The cumulative distribution of the MSCs (10 and 50 cGy) with varying FL1–BCL2 signal. (4). Median signals for FL1–BCL2. The cultivation times and radiation doses are shown in the figure. Average values and SD are given for three experiments. *p < 0.001 (U test). (D) FACS. (1–3) The cumulative distribution of the MSCs (10 cGy) with varying FL1–p53, FL1-ATM, and FL1–PPARG signals. The time of cell cultivation after LDIR is shown in the figure. (E) FACS (1, 2). (1) The distribution of the MSCs (50 cGy) with varying FL1–annexin V. R: gated area, cells with an increased annexin V level. (2) The content of the cells with an increased annexin V level. (3) Evaluation of cell viability 72 h after irradiation. MTT test, the number of the attached cells, and the total cell number. Parameter values are normalized to the control values.

