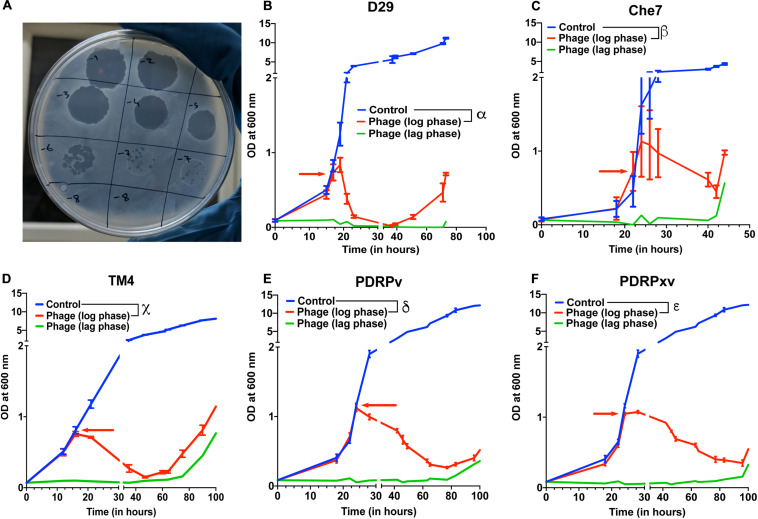
FIGURE 1.
Efficacy of infection and evolution of phage resistance is dependent on individual Mycobacteriophages. (A) Photograph showing spot clearance of a lawn of M. smegmatis after treatment with D29. Growth curves of M. smegmatis in liquid culture in the presence of (B) D29, (C) Che7, (D) TM4, (E) PDRPv, and (F) PDRPxv phage. Red arrow represents the time point at which phage solution was added to the cultures. These experiments were repeated several times (≥2) and the representative graphs were plotted. Multiple t-test with Holm-Sidak method was used to estimate the statistical significance. α represents a significant difference (p < 0.05) between control and D29 treated (log phase) for all time points between 21 and 73 h. β represents a significant difference (p < 0.05) between control and Che7 treated (log phase) for all time points between 28 and 44 h. χ represents a significant difference (p < 0.05) between control and TM4 treated (log phase) for all time points between 21and 105 h. δ represents a significant difference (p < 0.05) between control and PDRPv treated (log phase) for all time points between 28 and 106 h. ε represents a significant difference (p < 0.05) between control and PDRPxv treated (log phase) for all time points between 24 and 106 h.

