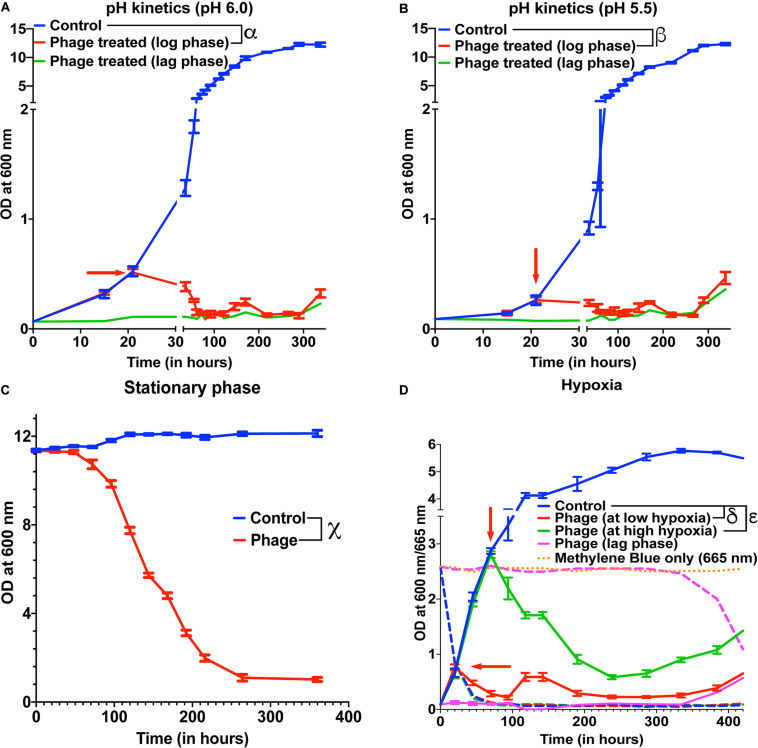
FIGURE 3.
Mycobacteriophages are effective under various pathophysiological conditions. Growth kinetics of M. smegmatis cultures treated with a five-phage cocktail at (A) pH condition of 6.0, (B) pH condition of 5.5, (C) stationary phase, and (D) hypoxic conditions. For hypoxia experiment, solid lines represent bacterial OD at 600 nm and dashed lines are the respective Methylene Blue readings at 665 nm. Red arrow represents the time point phage solution was added to the cultures. These experiments were repeated twice and the representative graphs are shown here. For A, B, and C, multiple t-test with Holm-Sidak method was used to estimate the statistical significance (p < 0.05). α represents a significant difference (p < 0.05) between control and phage cocktail treated (pH 6.0, log phase) for all time points between 36 and 338 h. β represents a significant difference (p < 0.05) between control and phage cocktail treated (pH 5.5, log phase) for all time points between 73 and 338 h. χ represents a significant difference (p < 0.05) between control and phage cocktail treated (stationary phase) for all time points between 24 and 360 h. For D, 2-way ANOVA with Sidak’s multiple comparisons test was used to determine statistical significance (p < 0.05). δ represents a significant difference between control and phage (at low hypoxia) for all time points between 45 and 432 h, and ε represents a significant difference between control and phage (at high hypoxia) for all time points between 94 and 432 h.

