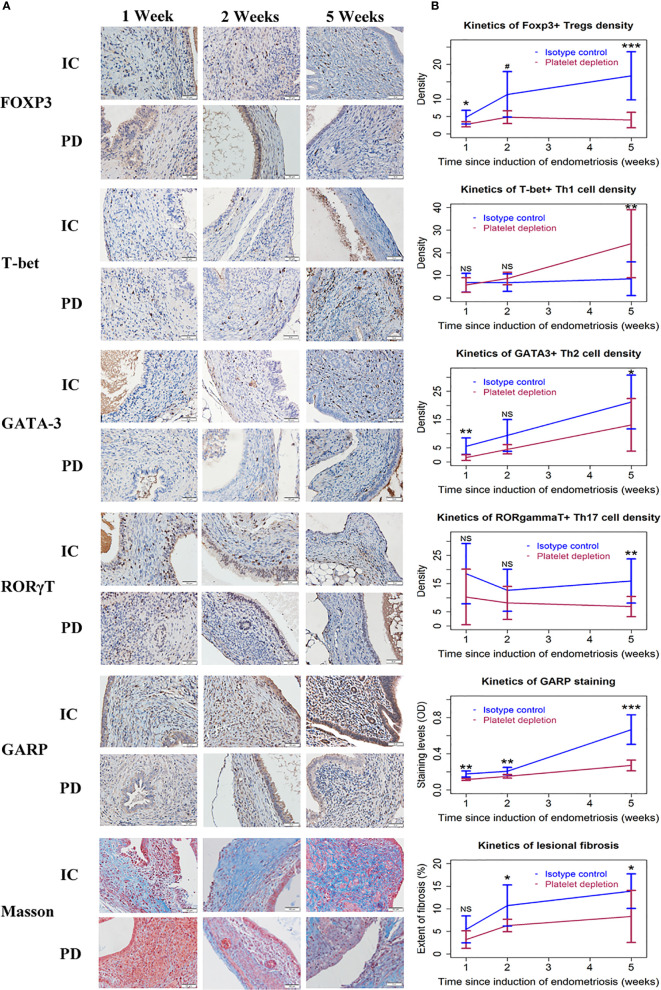
Figure 3.
The distribution of T cells, GARP staining, and Masson trichrome staining in endometriotic lesions of the two groups of mice in Experiment 1. (A) Representative immunohistochemical staining of FOXP3, T-bet, GATA-3, RORγT, GARP, along with Masson trichrome staining in the two groups. All magnifications were ×400. Scale bar = 50 µm. (B) Kinetic changes in the density of FOXP3+ (Treg), T-bet+ (Th1), GATA-3+ (Th2), and RORγT+ (Th17) cells, the staining level of GARP, and the percentage of fibrotic content in the two groups. The values show the means ± SDs. *p < 0.05; **p < 0.01; ***p < 0.001; NS, not statistically significant (p > 0.05) for the difference between the testing group and the Control group (by Wilcoxon’s test). n = 7 for each group in 1 and 2 weeks; n = 10 for each group in 5 weeks. One mouse in the PD group died of internal bleeding at 1 week after induction. IC, isotype control; PD, platelet depletion; GARP, glycoprotein A repetitions predominant.

