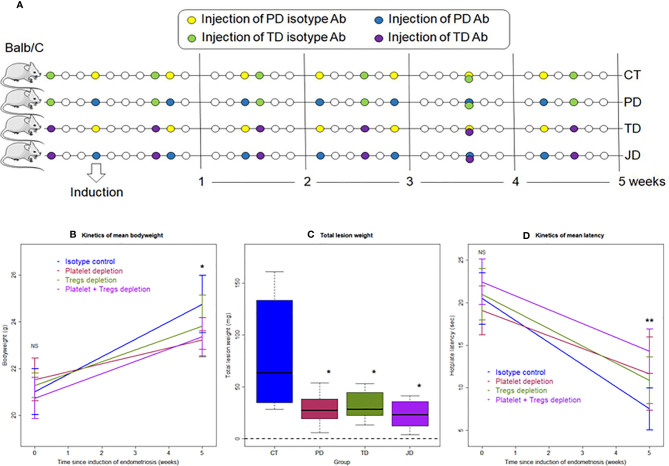
Figure 5.
Schematic illustration of the experimental design, kinetics of bodyweight, lesion weight, and hotplate latency of the four groups of mice in Experiment 2. (A) Schematic illustration of the experimental design. The yellow circles represent the injection of mock isotype antibody for the anti-platelet antibody; the blue circles represent the injection of anti-platelet antibody; the purple circles represent the injection of anti-CD25 antibody (PC61); and the green circles represent the injection of mock isotype antibody for PC61. All mice were sacrificed 35 days after induction. (B) Kinetic changes in mean bodyweight. (C) Boxplots showing the Lesion weight. (D) Kinetic changes in mean hotplate latency. The values show the means ± SDs. *p < 0.05; **p < 0.01; NS: not statistically significant (p > 0.05) for the difference between the testing group and the Control group (by Wilcoxon’s test). n = 8 for each group. CT, Control group; PD, platelet depletion; TD, Tregs depletion; JD, joint (simultaneous) depletion of platelet and Treg; Ab, antibody.

