Figure 2.

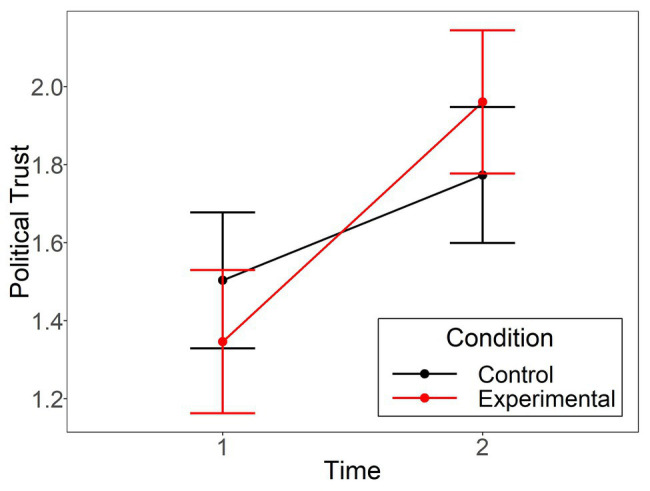
The political trust means in Study 2 at time 1 and 2 are displayed separately for the control and experimental group. Error bars represent 95% confidence intervals.

The political trust means in Study 2 at time 1 and 2 are displayed separately for the control and experimental group. Error bars represent 95% confidence intervals.