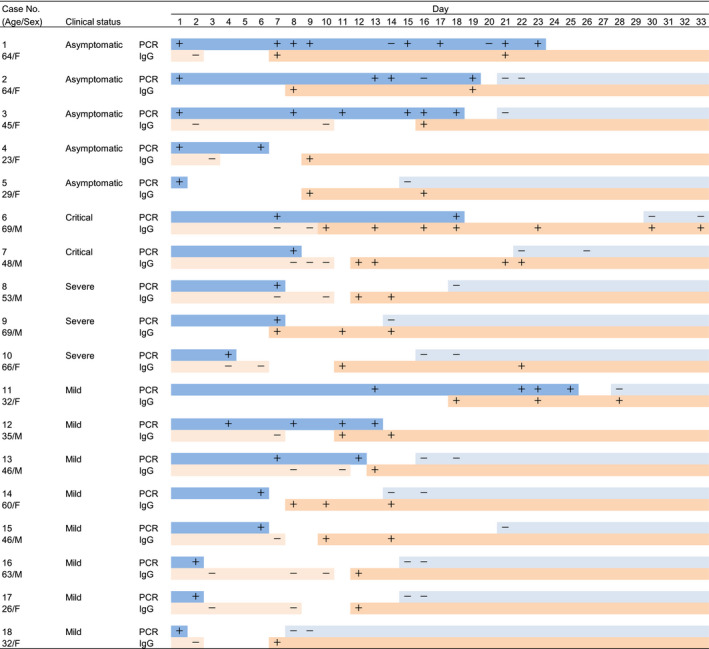
FIGURE 1.

Clinical course of anti‐SARS‐CoV‐2 IgG and PCR positivity. The collection period of this study was from day 1 to day 33. PCR+/− in each case indicates positive and negative PCR results, respectively, on the day when PCR testing was performed after day 1. IgG+/− in each case indicates positive and negative IgG results, respectively, on the day when antibody kit testing was performed after day 1. The dark blue bars indicate the duration between day 1 of symptoms onset and the last day of a positive PCR result. The light blue bars indicate the duration between the first day of a negative PCR result after the last day of a positive PCR result and day 33. The light orange bars indicate the duration between day 1 of symptoms onset and the last day of a negative IgG result. The dark orange bars indicate the duration between the first day of a positive IgG result and day 33. The outlines indicate the duration that is not evident for PCR or IgG positivity in each case. Clinical status is defined in the Methods section. Day indicates the day after symptoms onset. Day 1 for asymptomatic patients began on the first day of PCR positivity
