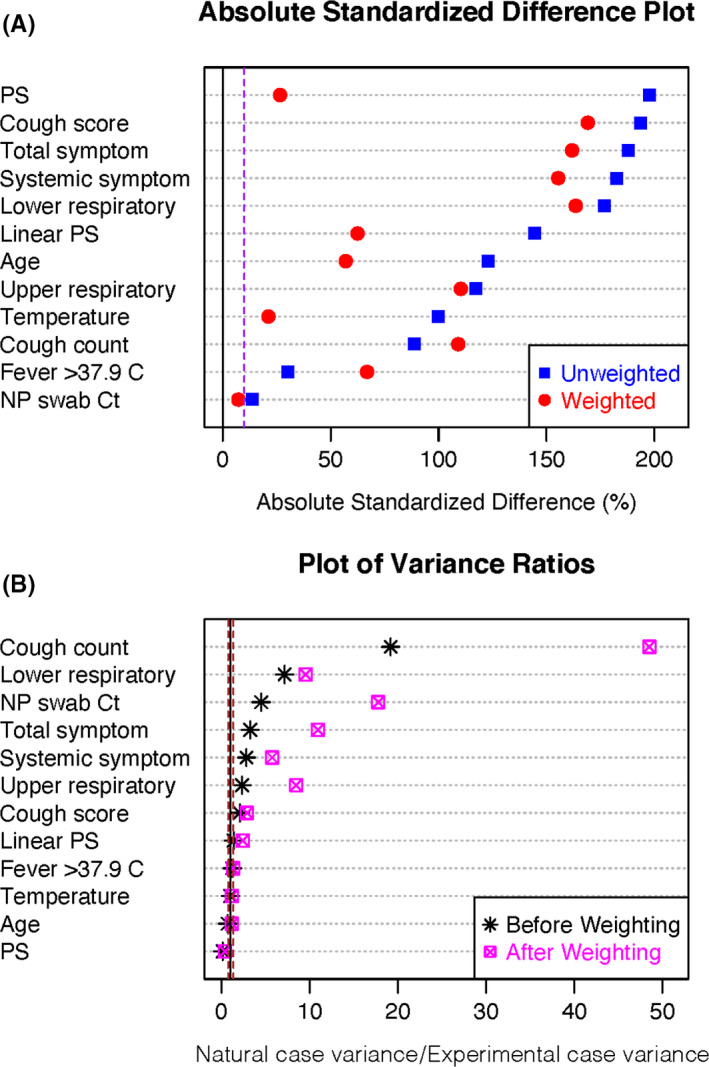
Figure 3.

Balance diagnostics for propensity score adjustment by average treatment effect, where the naturally infected cases are “treatment.” A, Absolute standardized differences between experimental and naturally infected case covariates plotted for each covariate, the propensity score (PS) and the linear PS. The dotted line represents 10%, which balanced groups do not generally exceed. B, Variance ratios. Dotted lines represent 0.5 and 2, the range for which balanced populations generally do not exceed
