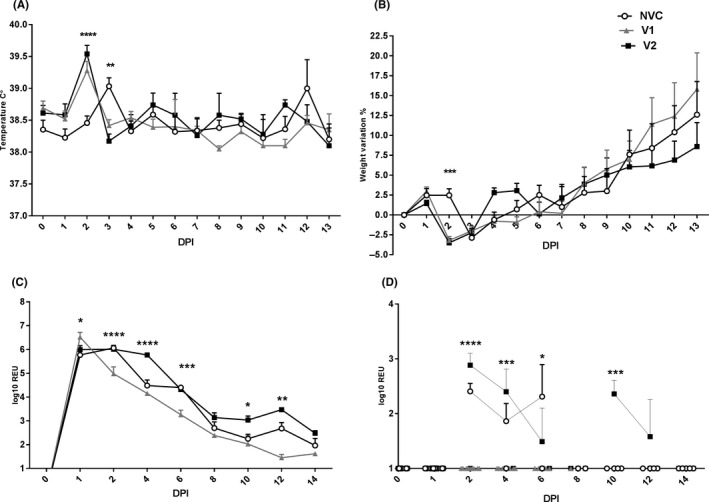
FIGURE 2.

Clinical signs. Mean temperature (A) and weight (B) for each day post‐infection (DPI) are shown for groups V1 (V1 vaccine), V2 (V2 vaccine) and NVC (non‐vaccinated control). The NVC group showed significantly lower (P < .0001) and higher temperature (P < .01) than the vaccinated groups (V1 and V2) at 2 and 3 dpi, respectively. The NVC group showed significantly (P < .001) lower weight percentage in comparison with vaccinated groups (B), at 2 dpi. Viral RNA detection and quantification by RT‐qPCR in nasal washes (C). The V1 group showed significantly higher viral loads at 1 dpi in comparison with the V2 and NVC groups (P < .05) and significantly lower viral loads than the V2 and NVC groups at 2, 6 (P < .0001) and 12 dpi (P < .01). The V2 group showed significantly higher viral loads in comparison with both the NVC and the V1 groups at 4 dpi (P < .0001) than the V1 group at 10 dpi (P < .05). Viral RNA detection and quantification by RT‐qPCR in rectal swabs (D). V1 presented with significantly lower viral loads than the V2 and NVC groups at 2 (P < .0001), 4 (P < .001) and 6 (P < .05) dpi. The V2 group showed significantly higher viral loads than the NVC and the V1 groups at 10 dpi (P < .001). RT‐qPCR graphs show relative equivalent units (REUs). The assay limit of RNA detection is reached at an REU of 1. All samples below the assay limit are shown as 1. Mean ± standard error of the mean (SEM). Statistical analysis was carried out using two‐way analysis of variance. Differences were considered statistically significant at P < .05, P < .01, P < .001 and P < .0001, and represented as *, **, *** or ****, respectively
