FIGURE 4.

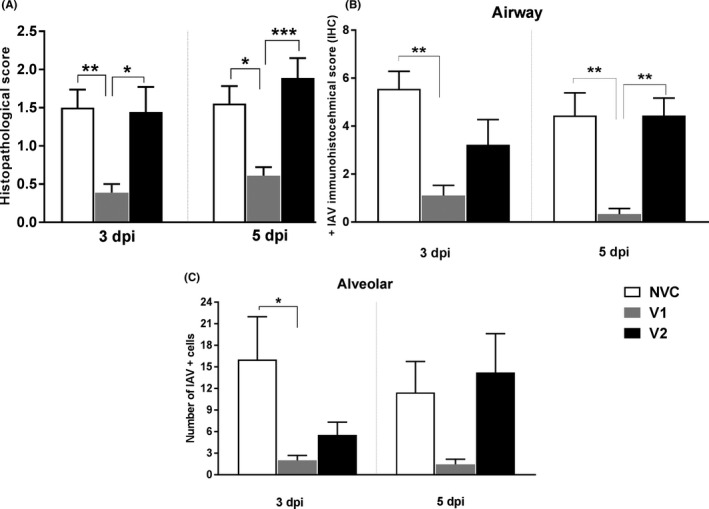
Pulmonary histological scores (A). Mean histopathological score of lung lobes. Mean ± SEM is shown. The V1 group showed significantly lower histopathological scores than the NVC (P < .01 and .05) and the V2 groups (P < .05 and .001), at 3 and 5 dpi, respectively. Influenza A virus antigen immunolabelling score in airway (bronchial/bronchiolar) (B) and alveolar (C) areas at 3 and 5 dpi. The V1 group had significantly lower nucleoprotein (NP) immunolabelling scores than the NVC group in airway (P < .01) and alveolar areas (P < .05) at 3 dpi. The V1 group also showed significantly lower immunolabelling scores than the NVC (P < .01) and the V2 (P < .01) groups in airway areas at 5 dpi. Mean ± SEM of NP‐positive immunolabelling per lung lobe. Statistical analysis was carried out using one‐way analysis of variance. Differences were considered statistically significant at P < .05, P < .01, P < .001 and P < .0001, and represented as *, **, *** or ****, respectively
