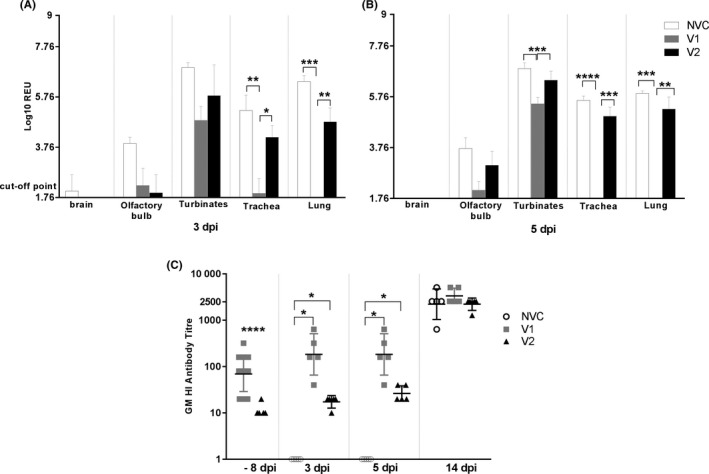
FIGURE 6.

Tissue distribution of influenza virus at 3 dpi (A) and 5 dpi (B). Mean ± standard error of the mean (SEM). Viral RNA quantification by RT‐qPCR on tissue homogenates. The V1 group showed significantly lower viral loads than the NVC and V2 groups in the trachea (P < .01 and .05) and lung (P < .001 and .01) at 3 dpi. The V1 group showed significantly lower viral load than the NVC and V2 groups in nasal turbinates (P < .001), trachea (P < .0001(NVC) and P < .001(V2)) and lung (P < .001(NVC) and P < .01(V2)) at 5 dpi. Haemagglutination inhibition (HI) antibody titre (C). Pre‐ and post‐challenge geometric mean (GM) HI antibody response against A/Eng virus. Geometric mean and geometric standard deviation (SD). The V1 vaccine showed significantly higher HI titres than the V2 group at −8 dpi (P < .0001) and, than both the V2 and the NVC groups at 3 (P < .05 and 5 dpi (P < .05). Statistical analysis was carried out using Student's t test analysis for testing the differences between HI titres at −8 dpi/34 dpv between vaccinated groups and one‐way analysis of variance for the rest of all variables at each time point post‐infection. Differences were considered statistically significant at P < .05, P < .01, P < .001 and P < .0001, and represented as *, **, *** or ****, respectively.
