
Figure 1.
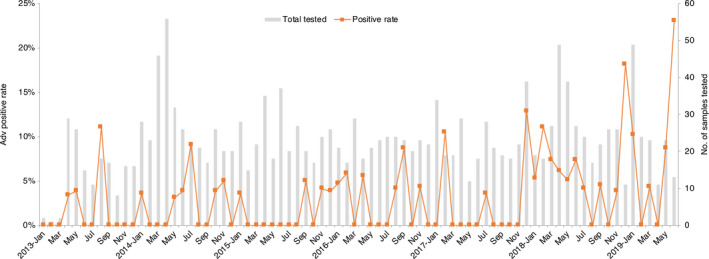
Distribution of HAdV‐positive cases among children hospitalized with pneumonia in Guangzhou, by month and year. Bars represent the total number of cases tested. The curve represents the HAdV‐positive rate for each month
Official websites use .gov
A
.gov website belongs to an official
government organization in the United States.
Secure .gov websites use HTTPS
A lock (
) or https:// means you've safely
connected to the .gov website. Share sensitive
information only on official, secure websites.
Distribution of HAdV‐positive cases among children hospitalized with pneumonia in Guangzhou, by month and year. Bars represent the total number of cases tested. The curve represents the HAdV‐positive rate for each month