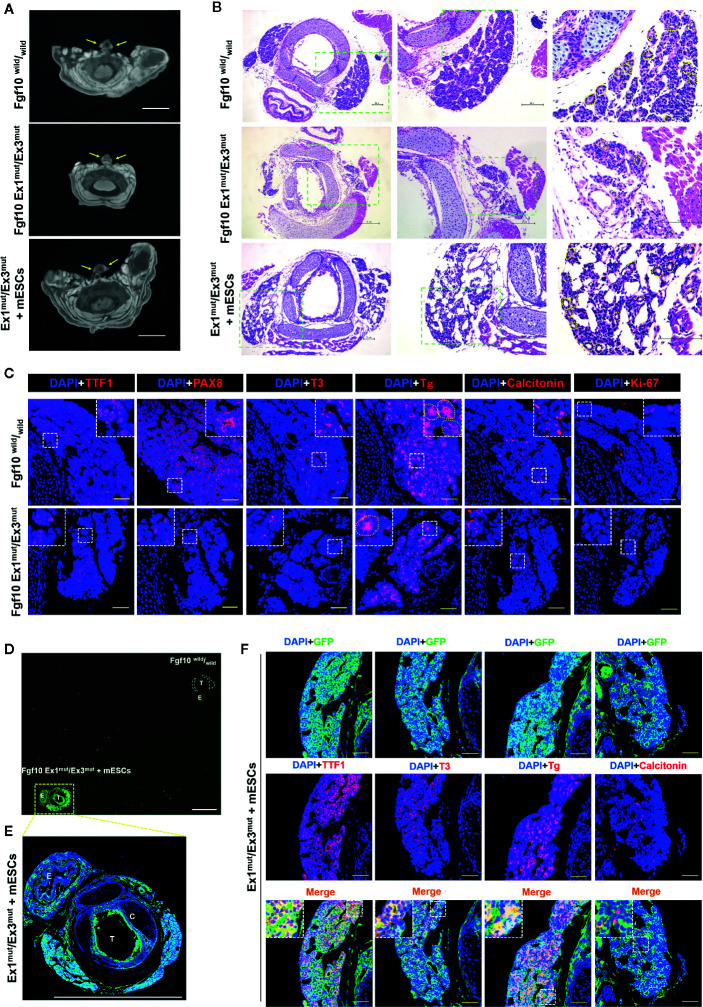
Figure 1.
Characterization of the thyroids of Fgf10 Ex1mut/Ex3mut neonates and Ex1mut/Ex3mut chimeric neonates complemented with mouse embryonic stem cells (mESCs). (A) Axial micro-computed tomography images of the neck regions of Fgf10 wild/wild and Ex1mut/Ex3mut neonates and Ex1mut/Ex3mut chimeric neonates. Yellow arrows indicate thyroid lobes adjacent to the tracheae. Scale bar = 2 mm. (B) Hematoxylin and eosin staining of cervical cross-sections of Fgf10 wild/wild and Ex1mut/Ex3mut neonates and Ex1mut/Ex3mut chimeric neonates. The right panels show magnified views of the areas indicated by the green dotted lines in the left panels. Scale bars = 100 μm. (C) Immunofluorescence staining of the thyroids of Fgf10 wild/wild and Ex1mut/Ex3mut neonates for various markers (red): TTF1, thyroid transcription factor1; PAX8, paired box gene 8; T3, tri-iodothyronine; Tg, thyroglobulin; Calcitonin and Ki-67. Nuclei were stained with DAPI (blue). Scale bars = 50 μm. Yellow dotted lines in (B, C) indicated representative thyroid follicles. (D–F) Immunofluorescence staining of the thyroid of an Fgf10 Ex1mut/Ex3mut chimeric neonate. (D) A low magnification image acquired using a stereo fluorescence microscope. The thyroid of an Fgf10 wild/wild neonate placed on the same slide served as the control. White dotted lines indicate the thyroid glands. (E) Image acquired using a confocal microscope (with slight magnification) of the tissue indicated by the yellow dotted box in (D). Scale bars = 1 mm. T, trachea; C, cartilage; E, esophagus. (F) Immunofluorescence staining of the thyroids of Fgf10 Ex1mut/Ex3mut neonates for GFP (green) and thyroid markers (red): TTF1, T3, Tg and Calcitonin. Nuclei were stained with DAPI (blue). Insets in (C, E) show magnified views of the areas indicated with white dotted lines. Scale bars = 50 μm.

