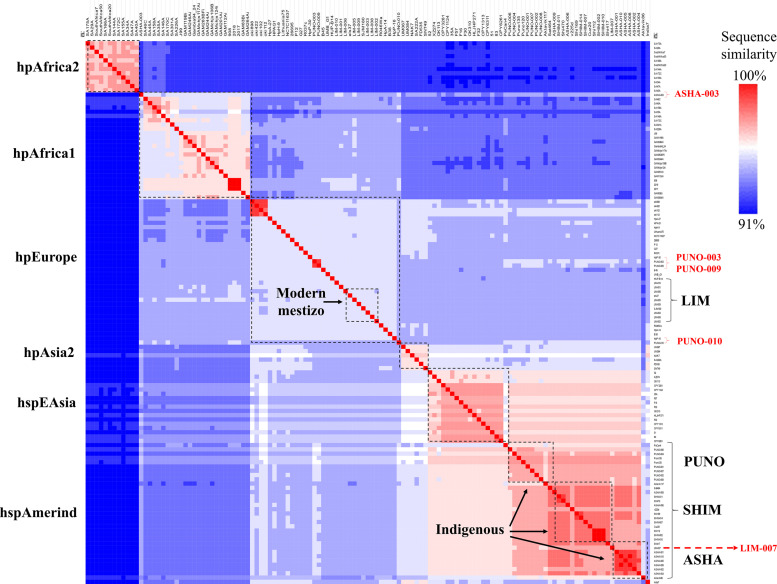
FIGURE 1.
Hierarchical clustering analysis of ANIb values. Each line represents the similarity score of each H. pylori genome (32 study and 95 references). Left, ancestral H. pylori populations. Right, H. pylori study populations. Heavily admixed genomes (ASHA-003, PUNO-003, PUNO-009, PUNO-010, and LIM-007) are shown in red font.

