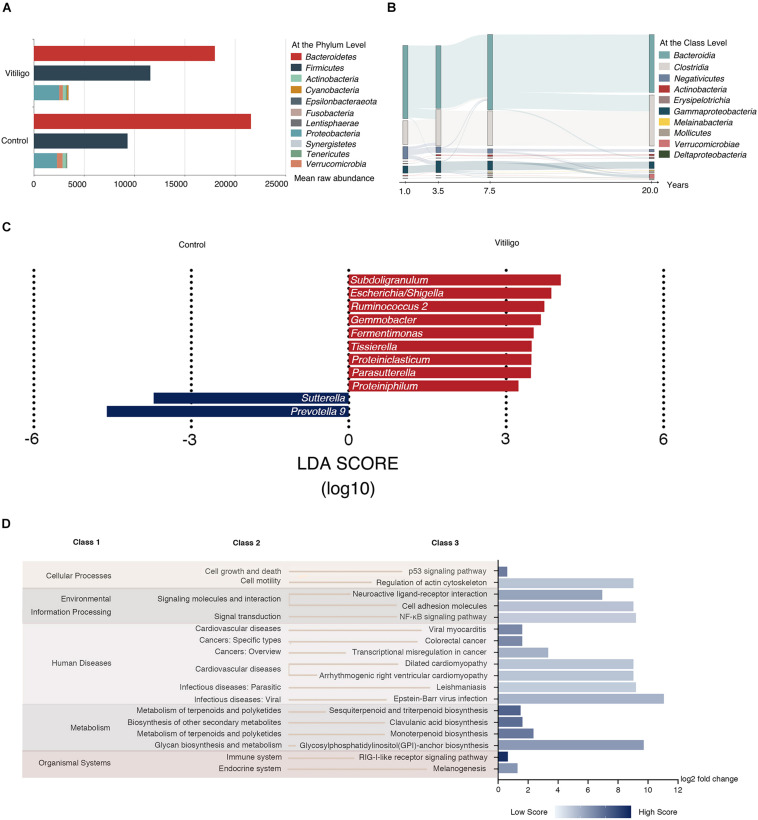
FIGURE 2.
Taxonomy composition and Tax4fun predictive function results of gut microbiome in vitiligo. (A) Mean raw abundance of fecal microbiome at the phylum level between vitiligo patients and healthy controls, for taxa with >1% mean raw abundance across all samples. Taxa with open bars show differential Bacteroidetes to Firmicutes raw abundance ratio between cohorts. (B) Patterns of gut microbiome mean raw abundance at the class level dynamics with the duration of disease were tracked using Sankey plots in vitiligo patients. (C) Microbial markers at the genus level in vitiligo by using LEfSe analyses. LEfSe analyses revealed that the relative abundances of 11 genera were significantly different between vitiligo patients and the control group. The abscissa represents LDA score (log10). (D) Tax4fun is used to infer the functional content of the gut microbiome based on 16S data. Fold change of the abundance of KEGG pathways between vitiligo patients and healthy controls assessed by the Wilcoxon signed-rank test with FDR < 0.05. The relative abundance score of each differential pathway enrichment is reflected by the color depth. The abscissa represents log2 fold change value of relative abundance score. Abbreviation: LDA, Linear Discriminant Analysis; KEGG, Kyoto Encyclopedia of Genes and Genomes; FDR, False Discovery Rate.

