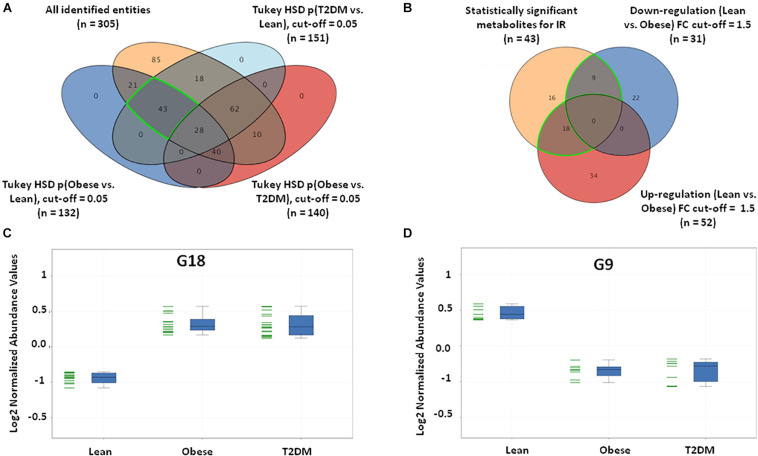
FIGURE 2.
IR metabolic model based on the positively identified features. (A) A Venn diagram showing that out of 3633 detected features, only 305 (~8%) metabolites were positively identified. 43 (G43) significant metabolites were considered a metabolic pattern for IR, where they were statistically significant between lean vs obese and lean vs T2D, and insignificant between obese vs T2D (FDR-corrected p-value < 0.05). (B) A Venn diagram showing the number of the up- and down-regulated metabolites after fold change analysis (cutoff l.5) on the significant metabolites (G43) (nine and 18 metabolites, respectively). (C) The expression profile of G18 and (D) G9 metabolites.

