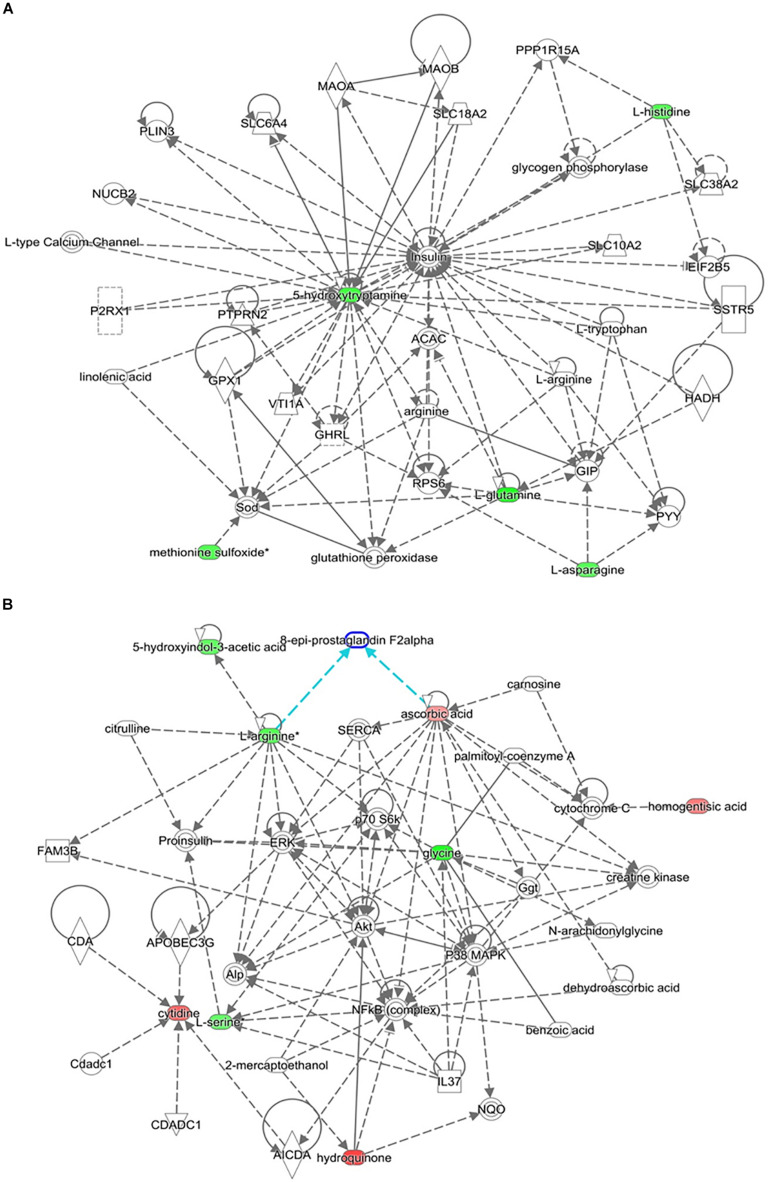
FIGURE 8.
Depicted top scoring I PA metabolomic networks. (A) “Cell-to-cell signaling and interaction, molecular transport, small molecule biochemistry “for IR metabolomic panel and (B) “cellular compromise, lip id metabolism, small molecule biochemistry” for T2DM metabolomic panel. The dotted lines indicate indirect and the straight lines indicate direct relationships. Nodes colored red represent up-regulation and green represent down-regulation. The interaction networks were generated through the use of IPA (QIAGEN Inc., https://www.qiagenbioinformatics.com/products/ingenuity-pathway-analysis/).

