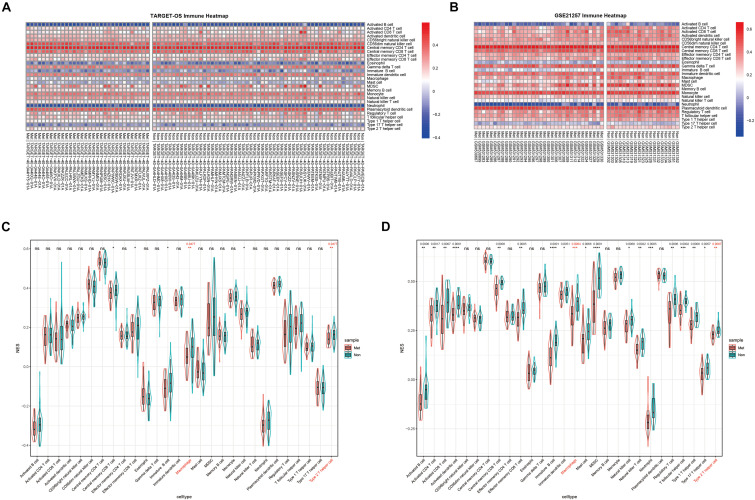
FIGURE 2.
The distribution of 28 TIIC subsets with metastasis or non-metastasis in OS. (A,B) Immune heatmap presents NESs of 28 TIIC subsets in each OS sample in TARGET-OS (A) and GSE21257 (B). (C,D) The NES differences of 28 TIIC subsets between metastasis and non-metastasis in TARGET-OS (C) and GSE21257 (D). Significant Q-values (<0.05) were shown above the asterisk of significant P-values. Significance levels: ****P < 0.0001; ***P < 0.001; **P < 0.01; *P < 0.05; ns, no significance.

