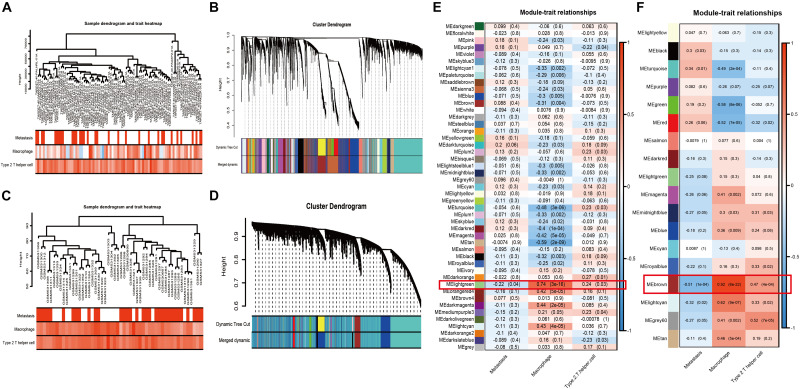
FIGURE 3.
WGCNA and module selection. (A,C) Sample dendrogram and trait heatmaps with metastasis, MA, and Th2 of TARGET-OS (A) and GSE21257 (C). In metastasis-trait, red represents patients with metastasis and white represents without metastasis; in MA and Th2-traits, the red or blue deeper, the positive or negative NESs higher. (B,D) Cluster dendrograms in TARGET-OS (B) and GSE21257 (D). (E,F) Heatmaps of module–trait relationships between gene modules and traits of metastasis, MA, and Th2 in TARGET-OS (E) and GSE21257 (F). The number in brackets on the right of each cell is the P-value, and the number on the left is the correlation coefficient.

