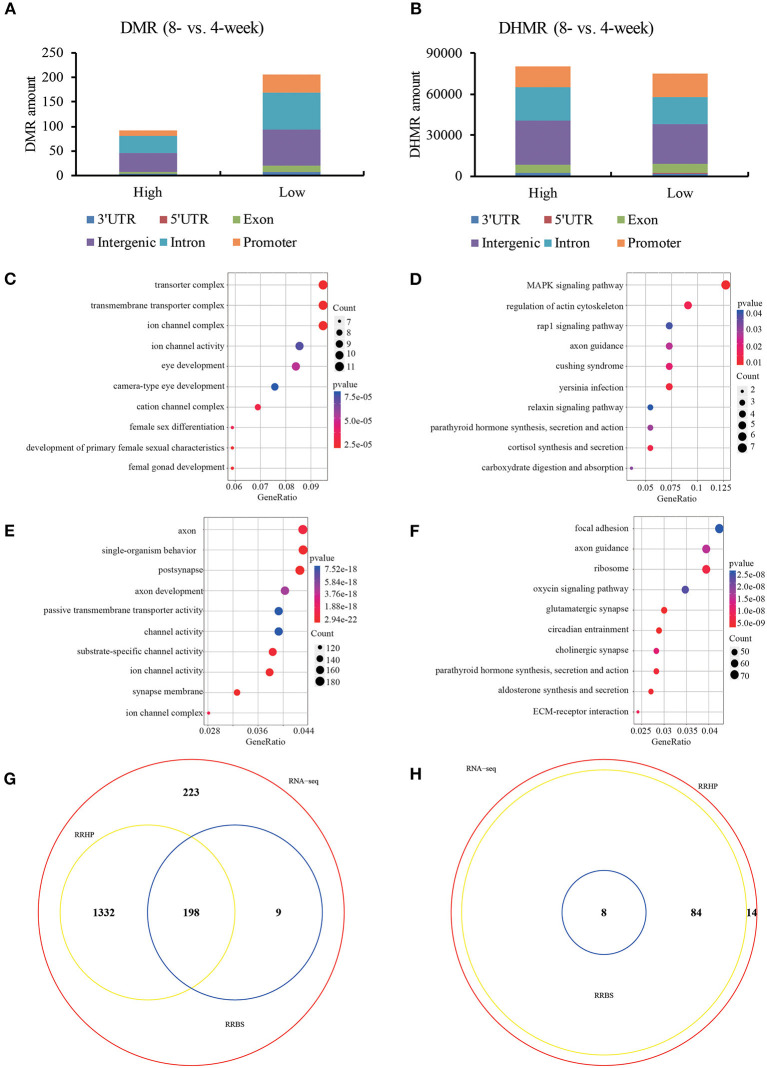
Figure 2.
DNA (hydroxy)methylation patterns of hypothalamic ARC in 4- and 8-weeks. The distribution of DMR (A) and DHMR (B) regions in genomic contexts of DEGs. DMR: differential methylated regions, FC > or < 20%, q < 0.05; DHMR: differential hydroxymethylated regions, log2FC >1 or < −1, q < 1e-4. Ontology analysis of the involved enriched functions (C) and signaling pathways (D) of differential methylated DEGs (p < 0.05). Ontology analysis of the involved enriched functions (E) and signaling pathways (F) of differential hydroxymethylated DEGs (p < 0.05). The Venn diagram view of enriched functions (G) and signaling pathways (H) among DEGs with differential (hydroxyl)methylation.

