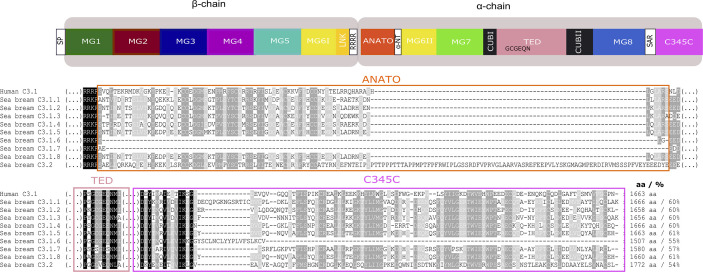
Figure 10.
Comparison of the gilthead sea bream C3 isoforms with the human C3. The protein domains in which most differences were found ANATO, TED, and C345C and may cause functional differences between the gilthead sea bream and human and within the gilthead sea bream C3 paralogues are represented. Symbol description is available in the legend of Figure 8 . The multiple sequence alignment of the full protein is available as Supplementary Figure 6 . Sequence conservation is denotated by background color gradient (black, total conservation; white, no conservation). The percent of similarity between the nine gilthead sea bream C3 isoforms with human C3.1 is indicated.

