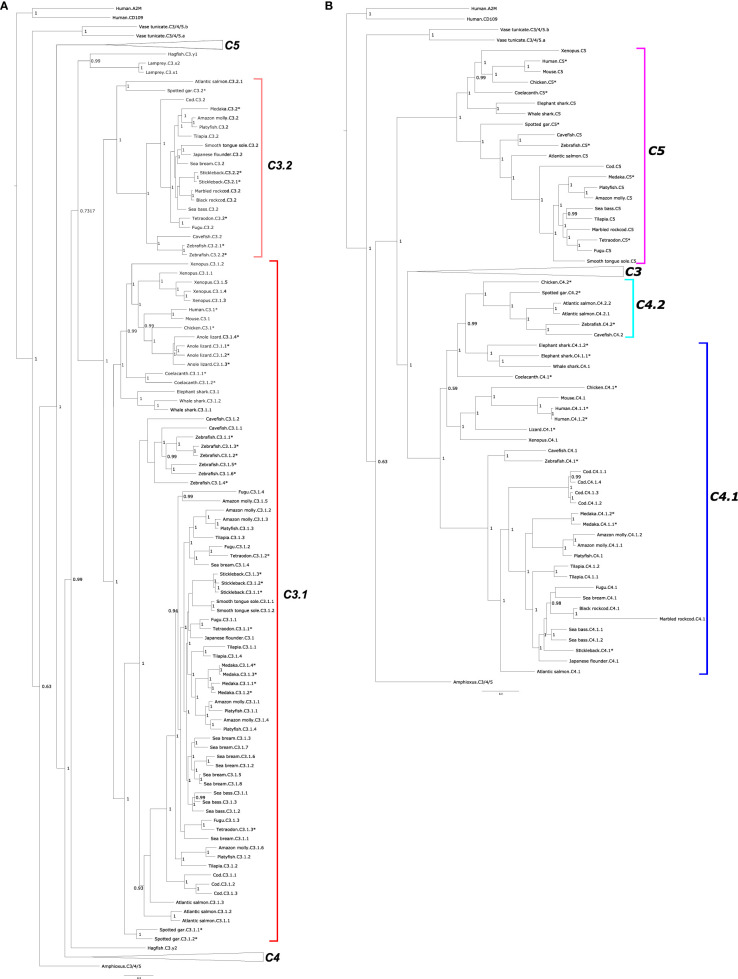
Figure 2.
Phylogenetic tree of complement factors C3, C4, and C5 in fish and other vertebrates. The tree was built only with full-length (both β- and α-chain) sequences and homologues from a urochordate (Ciona intestinalis) and a cephalochordate (Branchiostoma floridae) were also included to understand the evolutionary context. The tree was built with the BI method and branch support values (posterior probability values) are shown. Two subsets of the same phylogenetic tree showing different family members: (A) C3 and (B) C4 and C5 are represented to facilitate interpretation. In (A) the two major C3 clades were named C3.1 (red) and C3.2 (pink). For (B) the two C4 clades were named C4.1 (dark blue) and C4.2 (light blue). The teleost C5 clade is boxed in purple. The C4 sequences of the coelacanth and cartilaginous fishes (elephant shark and whale shark) were named C4.1 based on the similarity of their gene environment with the other vertebrate C4.1 genome regions. Duplicated fish c3 and c4 genes are numbered arbitrarily. The tree was rooted with the deduced protein sequences from human α-macroglobulin (A2M, ENST00000318602.12) and cluster of Differentiation 109 (CD109, ENST00000437994.6). The species for which gene linkage analysis was performed ( Figures 4 – 6 ) are indicated by an asterisk (*). Sequence accession numbers are available in Supplementary Table 1 and nototheniid deduced protein sequences are available as Supplementary Data . A similar tree built with the Maximum Likelihood (ML) method is presented as Supplementary Figure 2 .

