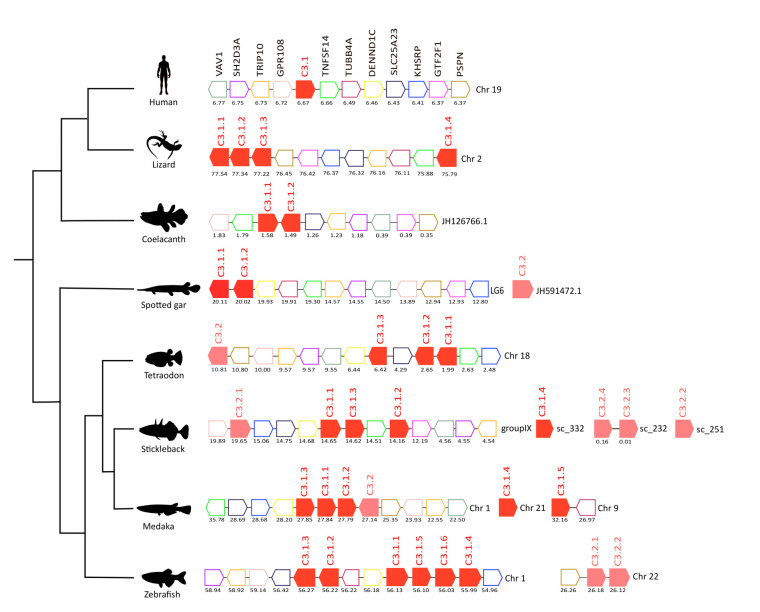
Figure 4.
Gene synteny analysis of the C3 gene environment in tetrapods and fish. Genes predicted in the genome are represented by arrows and the arrowheads indicate the gene orientation. C3 genes are represented by full-colored arrows: C.3.1 in red and C.3.2 in pink. Neighboring gene families are represented by different colors and gene homologues are indicated in the same color. The genes are mapped on the chromosomes and their actual positions (Mega base pairs, Mbp) is indicated below. Only genes that were conserved in the homologous genome regions in all species compared are represented. Tumor necrosis factor 14 (TNFSF14), Tubulin beta-4A chain (TUBB4A), DENN domain-containing protein 1C (DENND1C), Solute carrier family 25 member 23 (SLCA25A), Far upstream element-binding protein 2 (KHSRP), General transcription factor IIF subunit 1 (GTF2F1), Persephin (PSPN), Protein GPR108 (GPR108), Cdc42-interacting protein 4 (TRIP10), SH2 domain-containing protein 3A (SH2D3A), Proto-oncogene-vav (VAV1).

