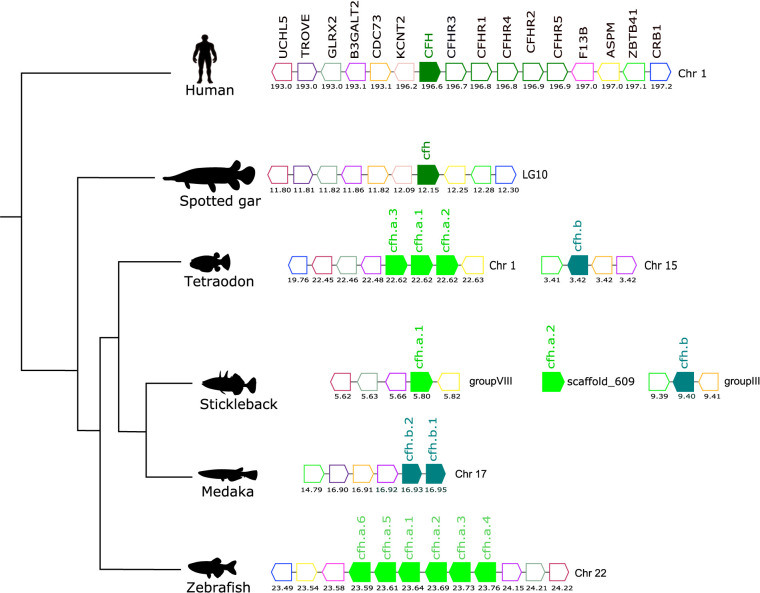
Figure 7.
Gene synteny analysis of the CFH/CFHR gene environment in tetrapod and fish. Arrows represent genes predicted in the genome and arrowheads indicate the gene orientation. The vertebrate CFH genes are represented by full coloured arrows: tetrapod and spotted gar (olive-green) and the teleost duplicates, cfha (light-green), and cfhb (green-blue). Neighboring genes families are represented by different colours and homologue genes between species are represented by the same coloured arrow. The genes are mapped on chromosomes according to their predicted positions (Mbp). Only genes that were conserved in the homologous genome regions in all species are represented. Coagulation factor XIII B chain (F13B), abnormal spindle microtubule assembly (ASPM), zinc finger and BTB domain containing 41 (ZBTB41), crumbs cell polarity complex component 1 (CRB1), potassium sodium-activated channel subfamily T member 2 (KCNT2), cell division cycle 73 (CDC73), beta-1,3-galactosyltransferase 2 (B3GALT2), Ro60, Y RNA binding protein (TROVE), Ubiquitin C-Terminal Hydrolase L5 (UCHL5).

