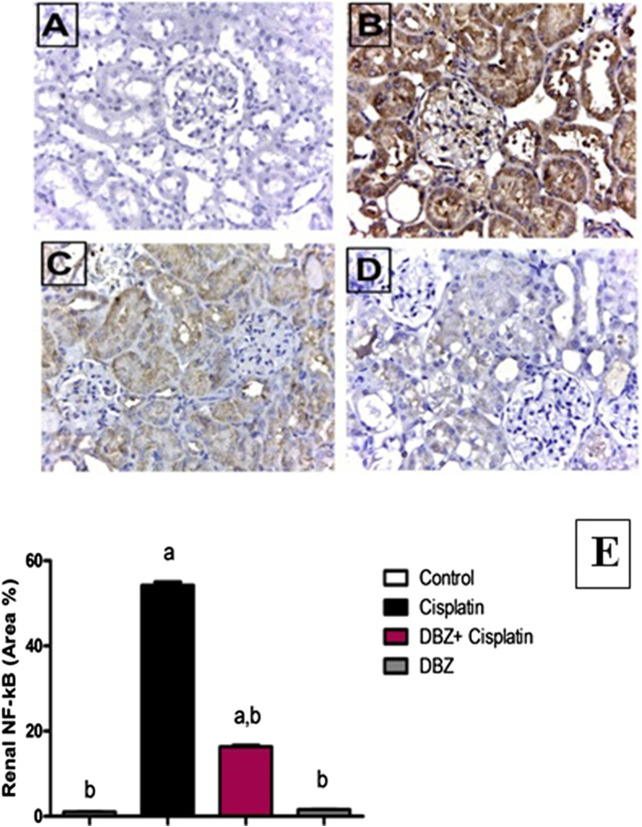
FIGURE 2.
The effect of dibenzazepine (2 mg/kg/day given i.p.) on NF-kB positive cells expression of kidney {X 400}. (A) Photomicrograph of kidney section of control group showing no expression of NF-kB. (B) Photomicrograph of kidney section of cisplatin group showing high immune-reactivity in the glomerular tuft and proximal tubules. (C) Photomicrograph of kidney section of pre-treated with DBZ group showing very low immune-reactivity in the glomerular tuft and proximal tubules. (D) Photomicrograph of kidney section of DBZ only showing no expression of NF-kB. (E) Quantitative image analysis for immunohistochemical staining expressed as area percent across 10 different fields for each rat section. Values are given as mean ± SD of six observations, a or b: Statistically significant from the control or the cisplatin group, respectively at p < 0.05 using ANOVA followed by Tukey–Kramer as a post-hoc test. DBZ, dibenzazepine. *Scale bar for all the previous photomicrographs is 25 μm.

