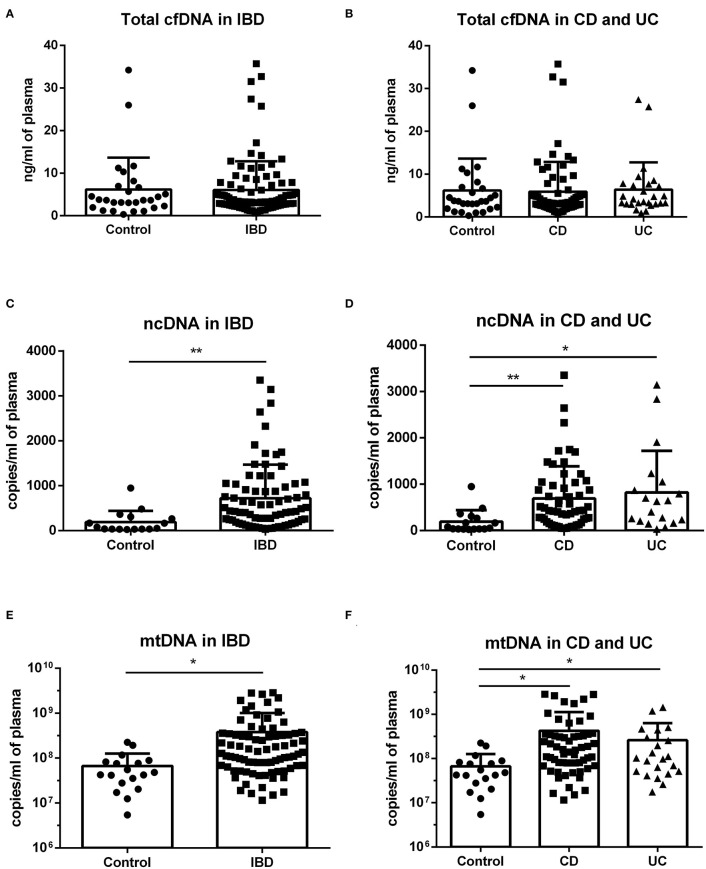
Figure 1.
Concentration of total cfDNA, ncDNA and mtDNA in IBD patients and controls. No difference in total cfDNA between healthy controls and patients was found (A,B). IBD patients showed higher levels of both ncDNA and mtDNA compared to healthy controls (C: p = 0.0061 and E: p = 0.0387). The difference was also seen in both subgroups of CD and UC patients (D: p = 0.0062 for CD and 0.0105 for UC against control and F: p = 0.0345 for CD and p = 0.0365 for UC against control). *P < 0.05, **P < 0.01.

