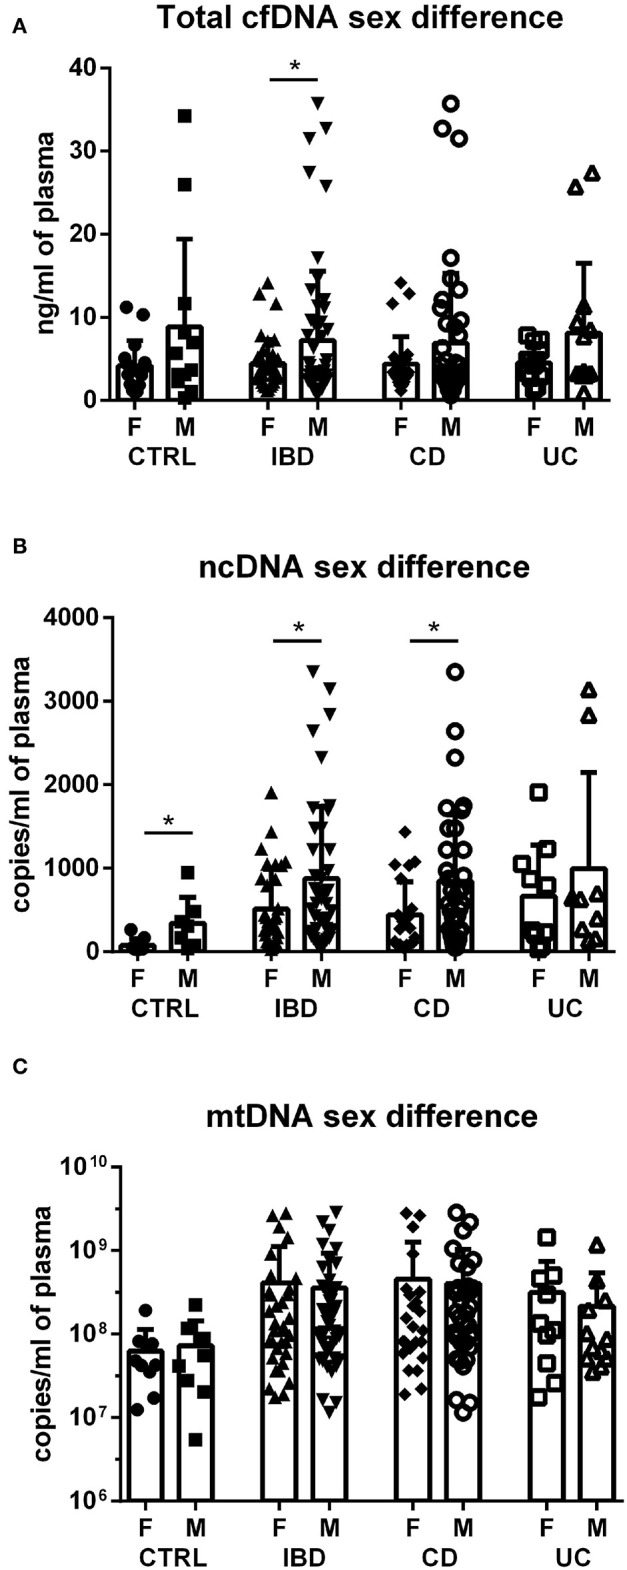
Figure 2.

Sex differences in cfDNA, ncDNA and mtDNA. Higher total cfDNA was found in male IBD patients compared with female patients (p = 0.0478); however, this difference was not found in the subgroups of CD and UC (A). Concentration of ncDNA is higher in males compared to females in healthy controls (p = 0.0274), IBD patients (p = 0.0345) and CD subgroup (p = 0.0309) (B). No sex difference was found in mtDNA in any of the groups (C). *P < 0.05.
