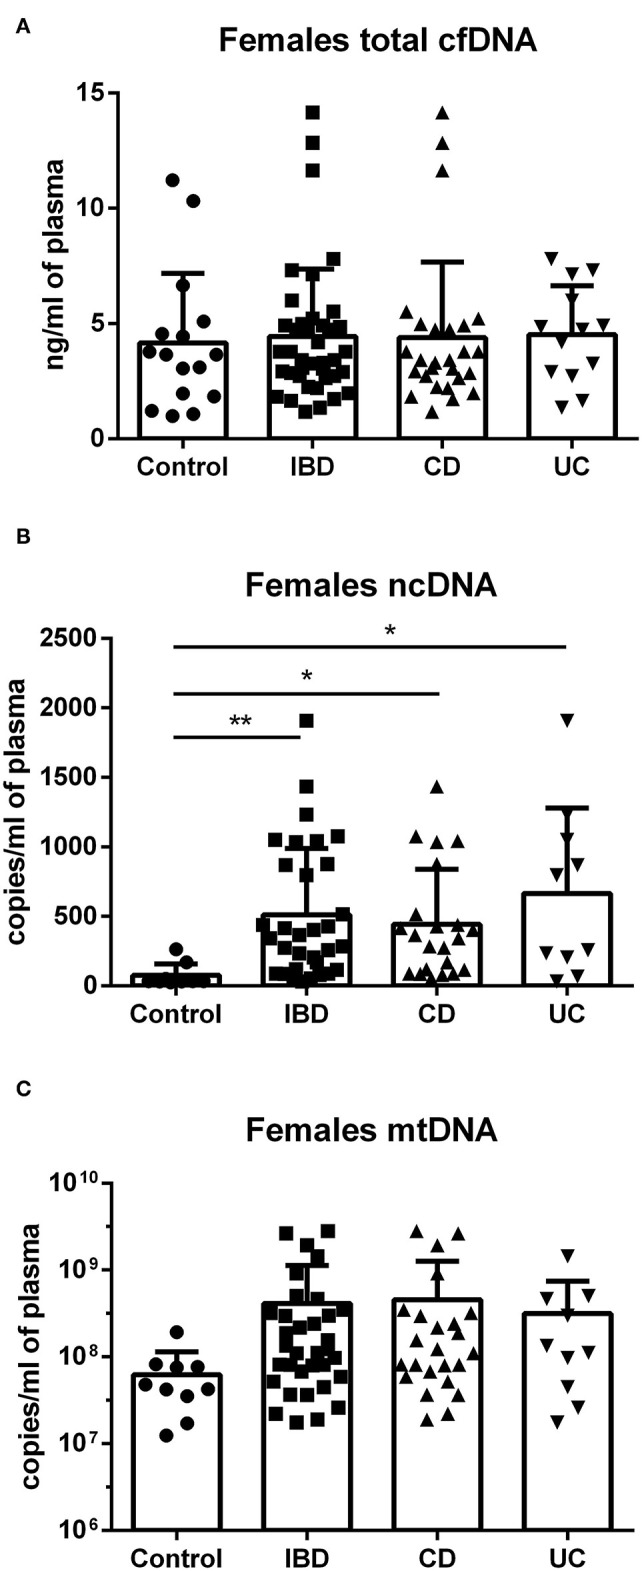
Figure 3.

Total cfDNA, ncDNA and mtDNA in females. No difference was found between groups in total cfDNA (A). Higher amount of ncDNA was found in female IBD patients (p = 0.0098), including both CD (p = 0.0108) and UC (p = 0.0110) compared to healthy controls (B). Similar trend is seen in mtDNA, although the differences were not significant (C). *P < 0.05, **P < 0.01.
