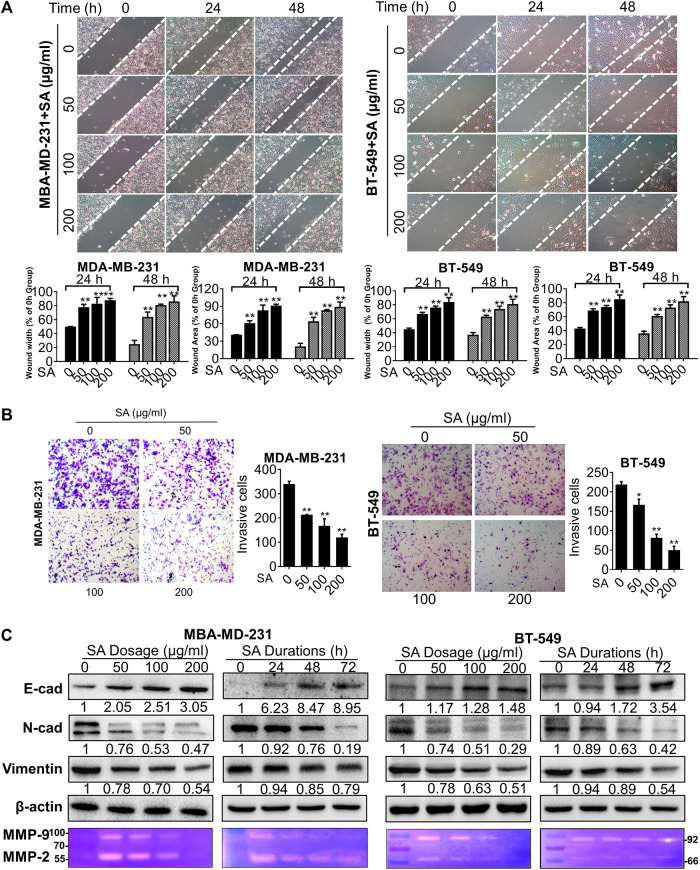
FIGURE 2.
SA suppresses migration and invasion in metastatic cells. (A) Representative phase-contrast images for wound healing assays. Left: quantification of migration distances; right: quantification of migration healing areas. (B) Representative images (left) and quantification (right) of decreased cell number in transwell chambers with or without SA (0–200 μg/ml). (C) Western blotting analysis of E-cad, N-cad and vimentin as well as gelatin zymography detection of MMP-2, and MMP-9 after the indicated SA treatment. All values represent the mean ± SD (n = 3, *p < 0.05, **p < 0.01).

