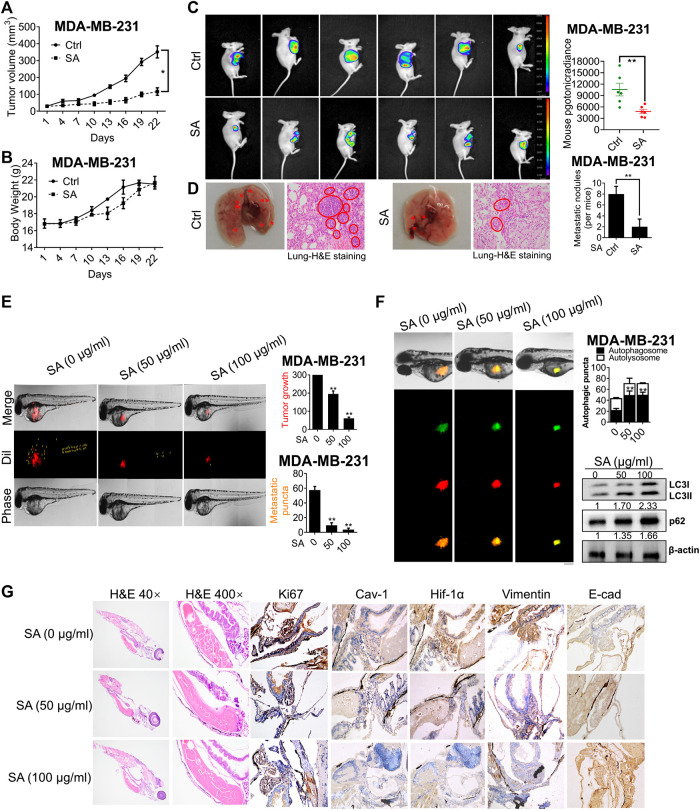
FIGURE 9.
SA suppresses breast cancer growth and metastasis in vivo and ex vivo. (A) Tumor volume, (B) body weight, (C) tumor-bioluminescence imaging, and (D) pulmonary metastatic nodules in nude mice bearing MDA-MB-231 cells with or without SA administration (n = 6, *p < 0.05, **p < 0.01). (E) The tumor foci in the control and SA-treated zebrafishes. Red fluorescence represented Dil-stained MDA-MB-231 cells, and yellow arrow labeled the position of disseminated tumor. (F) The effects of SA on autophagic flux was measured by LC3-GFP-mRFP reporter and the autophagy-associated indexes, LC3-II and p62, by western blotting analysis. Scale bar: 50 μM. (G) H&E staining and IHC detection of Ki-67, Cav-1, Hif-1α, vimentin, and E-cad expressions for each indicated group (n = 3, *p < 0.05, **p < 0.01).

