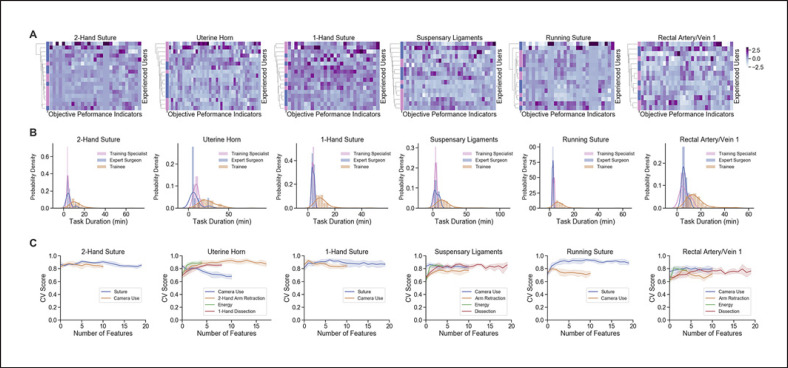
Fig. 4.
Analysis of OPIs across experience levels and feature selection. A Dendrograms of hierarchical clustering results for expert surgeons (blue) and non-surgeon training specialists (pink) along the y-axis. Heatmaps display z-score normalized values for OPIs and task durations with non-zero variance along the x-axis. B Distributions of task durations split by experience level. C Cross-validated (CV) scores (balanced accuracy, y-axis) of varying numbers of OPIs per skill (x-axis) using RFE.

