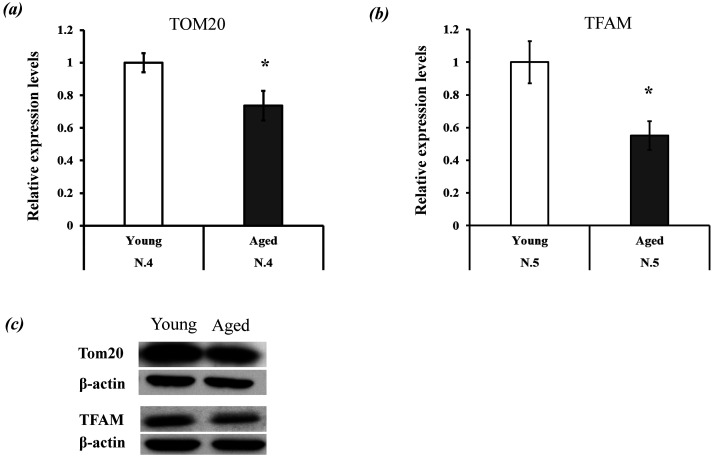
Fig. 3.
Comparison of mitochondrial quantity and quality between the two age groups. (a–b) Expression levels of TOMM20 and TFAM. These expression levels were normalized to actin expression, and the expression levels of young granulosa cells (GCs) were defined as 1.0. (c) Band pattern of TOMM20, TFAM, and actin. * P < 0.05.

