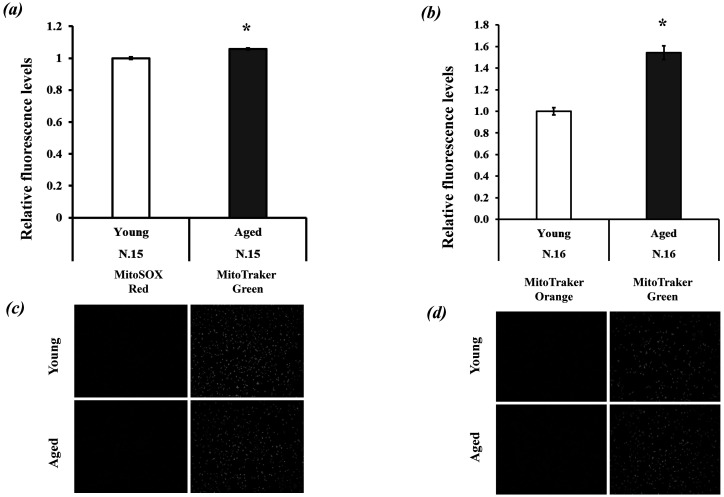
Fig. 4.
Relative fluorescence levels of (a) reactive oxygen species (ROS) and (b) mitochondrial membrane potential (MMP) and representative pictures of granulosa cells (GCs) stained with (c) MitoSOX and MitoTracker Green, and (d) MitoTracker Orange and MitoTracker Green. The values of young GCs were defined as 1.0. * P < 0.05.

