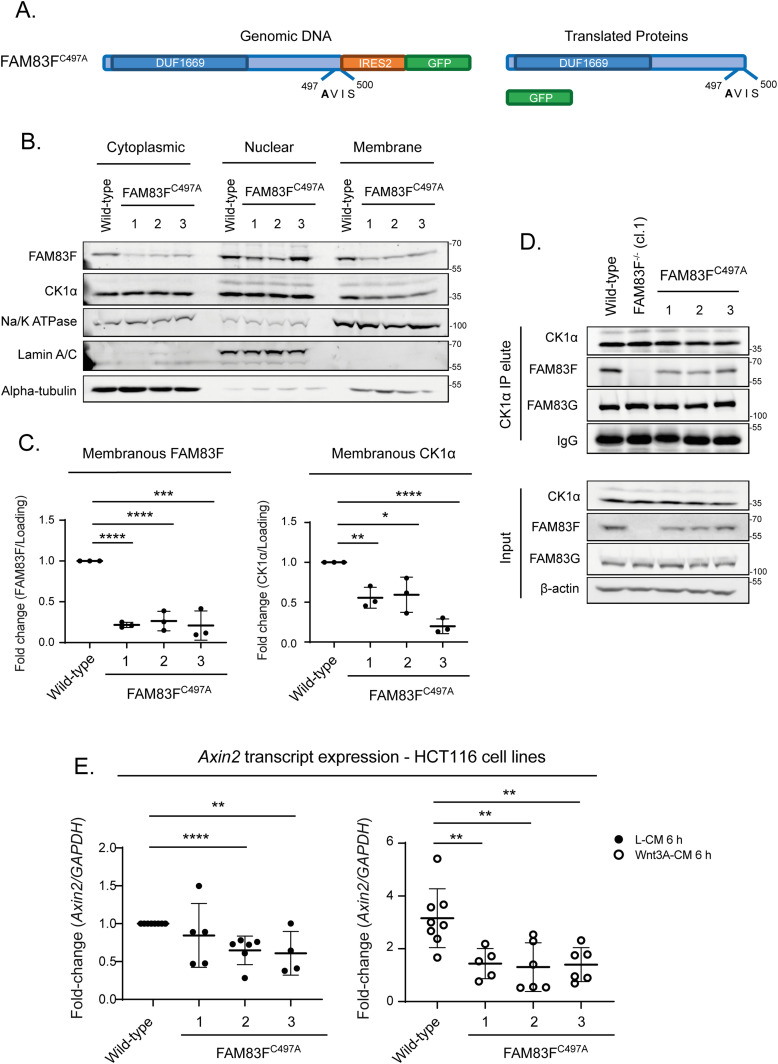
Figure 6. Membranous localisation of FAM83F is required for FAM83F’s role in canonical Wnt signalling.
(A) Cartoon of the FAM83FC497A knock-in strategy illustrating the genomic DNA sequence in which the C497A point mutation is knocked-in to FAM83F along with an IRES2 (Internal ribosome entry sequence) and GFP coding sequence which are inserted after the FAM83F protein coding sequence and the eventual translated proteins. (B) Cytoplasmic, nuclear and membrane lysates from HCT116 wild-type and HCT116 FAM83FC497A (clones 1–3) cell lines were resolved by SDS–PAGE and subjected to Western blotting with indicated antibodies. The specificity of cytoplasmic, nuclear and membrane compartment lysates was determined by Western blotting with the following subcellular compartment-specific antibodies: α-tubulin (cytoplasmic), Lamin A/C (nuclear), and Na/K ATPase (membrane). (C) Quantification of FAM83F and casein kinase 1α (CK1α) protein abundance in membrane enriched fractions from (B). FAM83F and CK1α protein abundance is normalised to loading control and presented as fold-change compared with HCT116 wild-type cells. Data presented as scatter graph illustrating individual data points with an overlay of the mean ± SD. (D) Cell lysates from HCT116 wild-type, HCT116 FAM83F−/− (cl.1), and HCT116 FAM83FC497A (clones 1–3) cell lines were subjected to immunoprecipitation with anti-CK1α antibody. Input lysates and CK1α IP elutes were resolved by SDS–PAGE and subjected to Western blotting with indicated antibodies. (E) qRT-PCR was performed using cDNA from HCT116 wild-type and HCT116 FAM83FC497A (clones 1–4) cell lines following treatment with L-CM or Wnt3A-CM for 6 h, and primers for Axin2 and GAPDH genes. Axin2 mRNA expression was normalised to GAPDH mRNA expression and represented as fold change compared with L-CM–treated wild-type cells. Data presented as scatter graph illustrating individual data points with an overlay of the mean ± SD. (C, E) Statistical analysis was completed using a Student’s unpaired t test and comparing cell lines as denoted on graphs. Statistically significant P-values are denoted by asterisks (**** < 0.0001, *** < 0.001, ** < 0.01, * < 0.05).
Source data are available for this figure.

