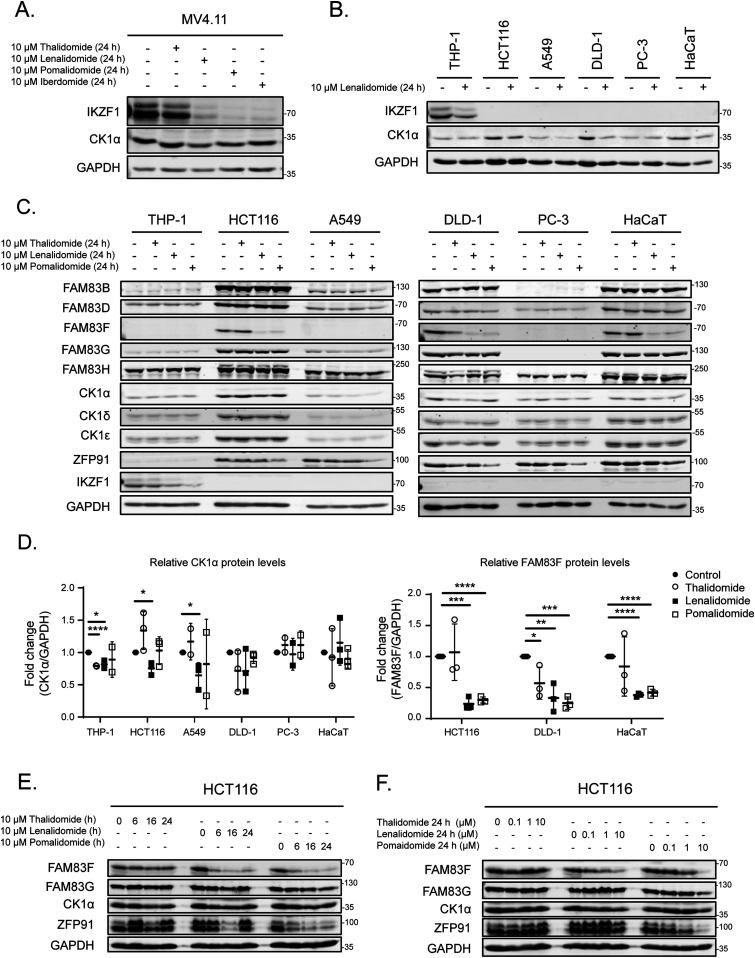
Figure 1. IMiDs degrade FAM83F but no other FAM83 proteins.
(A) MV4.11 cell extracts, treated with or without the IMiDs (10 μM for 24 h), were resolved by SDS–PAGE and subjected to Western blotting with the indicated antibodies. (B) THP-1, HCT116, A549, DLD-1, PC-3, and HaCaT cell extracts treated with or without 10 μM lenalidomide for 24 h were resolved by SDS–PAGE and subjected to Western blotting with the indicated antibodies. (C) THP-1, HCT116, A549, DLD-1, PC-3, and HaCaT cell extracts treated with or without IMiDs (10 μM for 24 h) were resolved by SDS–PAGE and subjected to Western blotting with the indicated antibodies. (D) Densitometry of FAM83F and CK1α protein abundance upon treatment with the indicated IMiDs (10 μM for 24 h). FAM83F and CK1α protein abundances were normalised to GAPDH protein abundance and represented as fold change compared to untreated cells. Data presented as scatter graph illustrating individual data points with an overlay of the mean ± SD. (E) HCT116 cell extracts, treated with 10 μM IMiDs for 6, 16, or 24 h, were resolved by SDS–PAGE and subjected to Western blotting with the indicated antibodies. (F) HCT116 cell extracts, treated with 0.1, 1 or 10 μM of IMiDs for 24 h, were resolved by SDS–PAGE and subjected to Western blotting with the indicated antibodies. Statistical analysis of data was completed using a Student’s unpaired t test and comparing fold change between untreated and IMiD treated samples. Statistically significant P-values are denoted by asterisks (* < 0.05, ** < 0.01, *** < 0.001, **** < 0.0001).
Source data are available for this figure.

