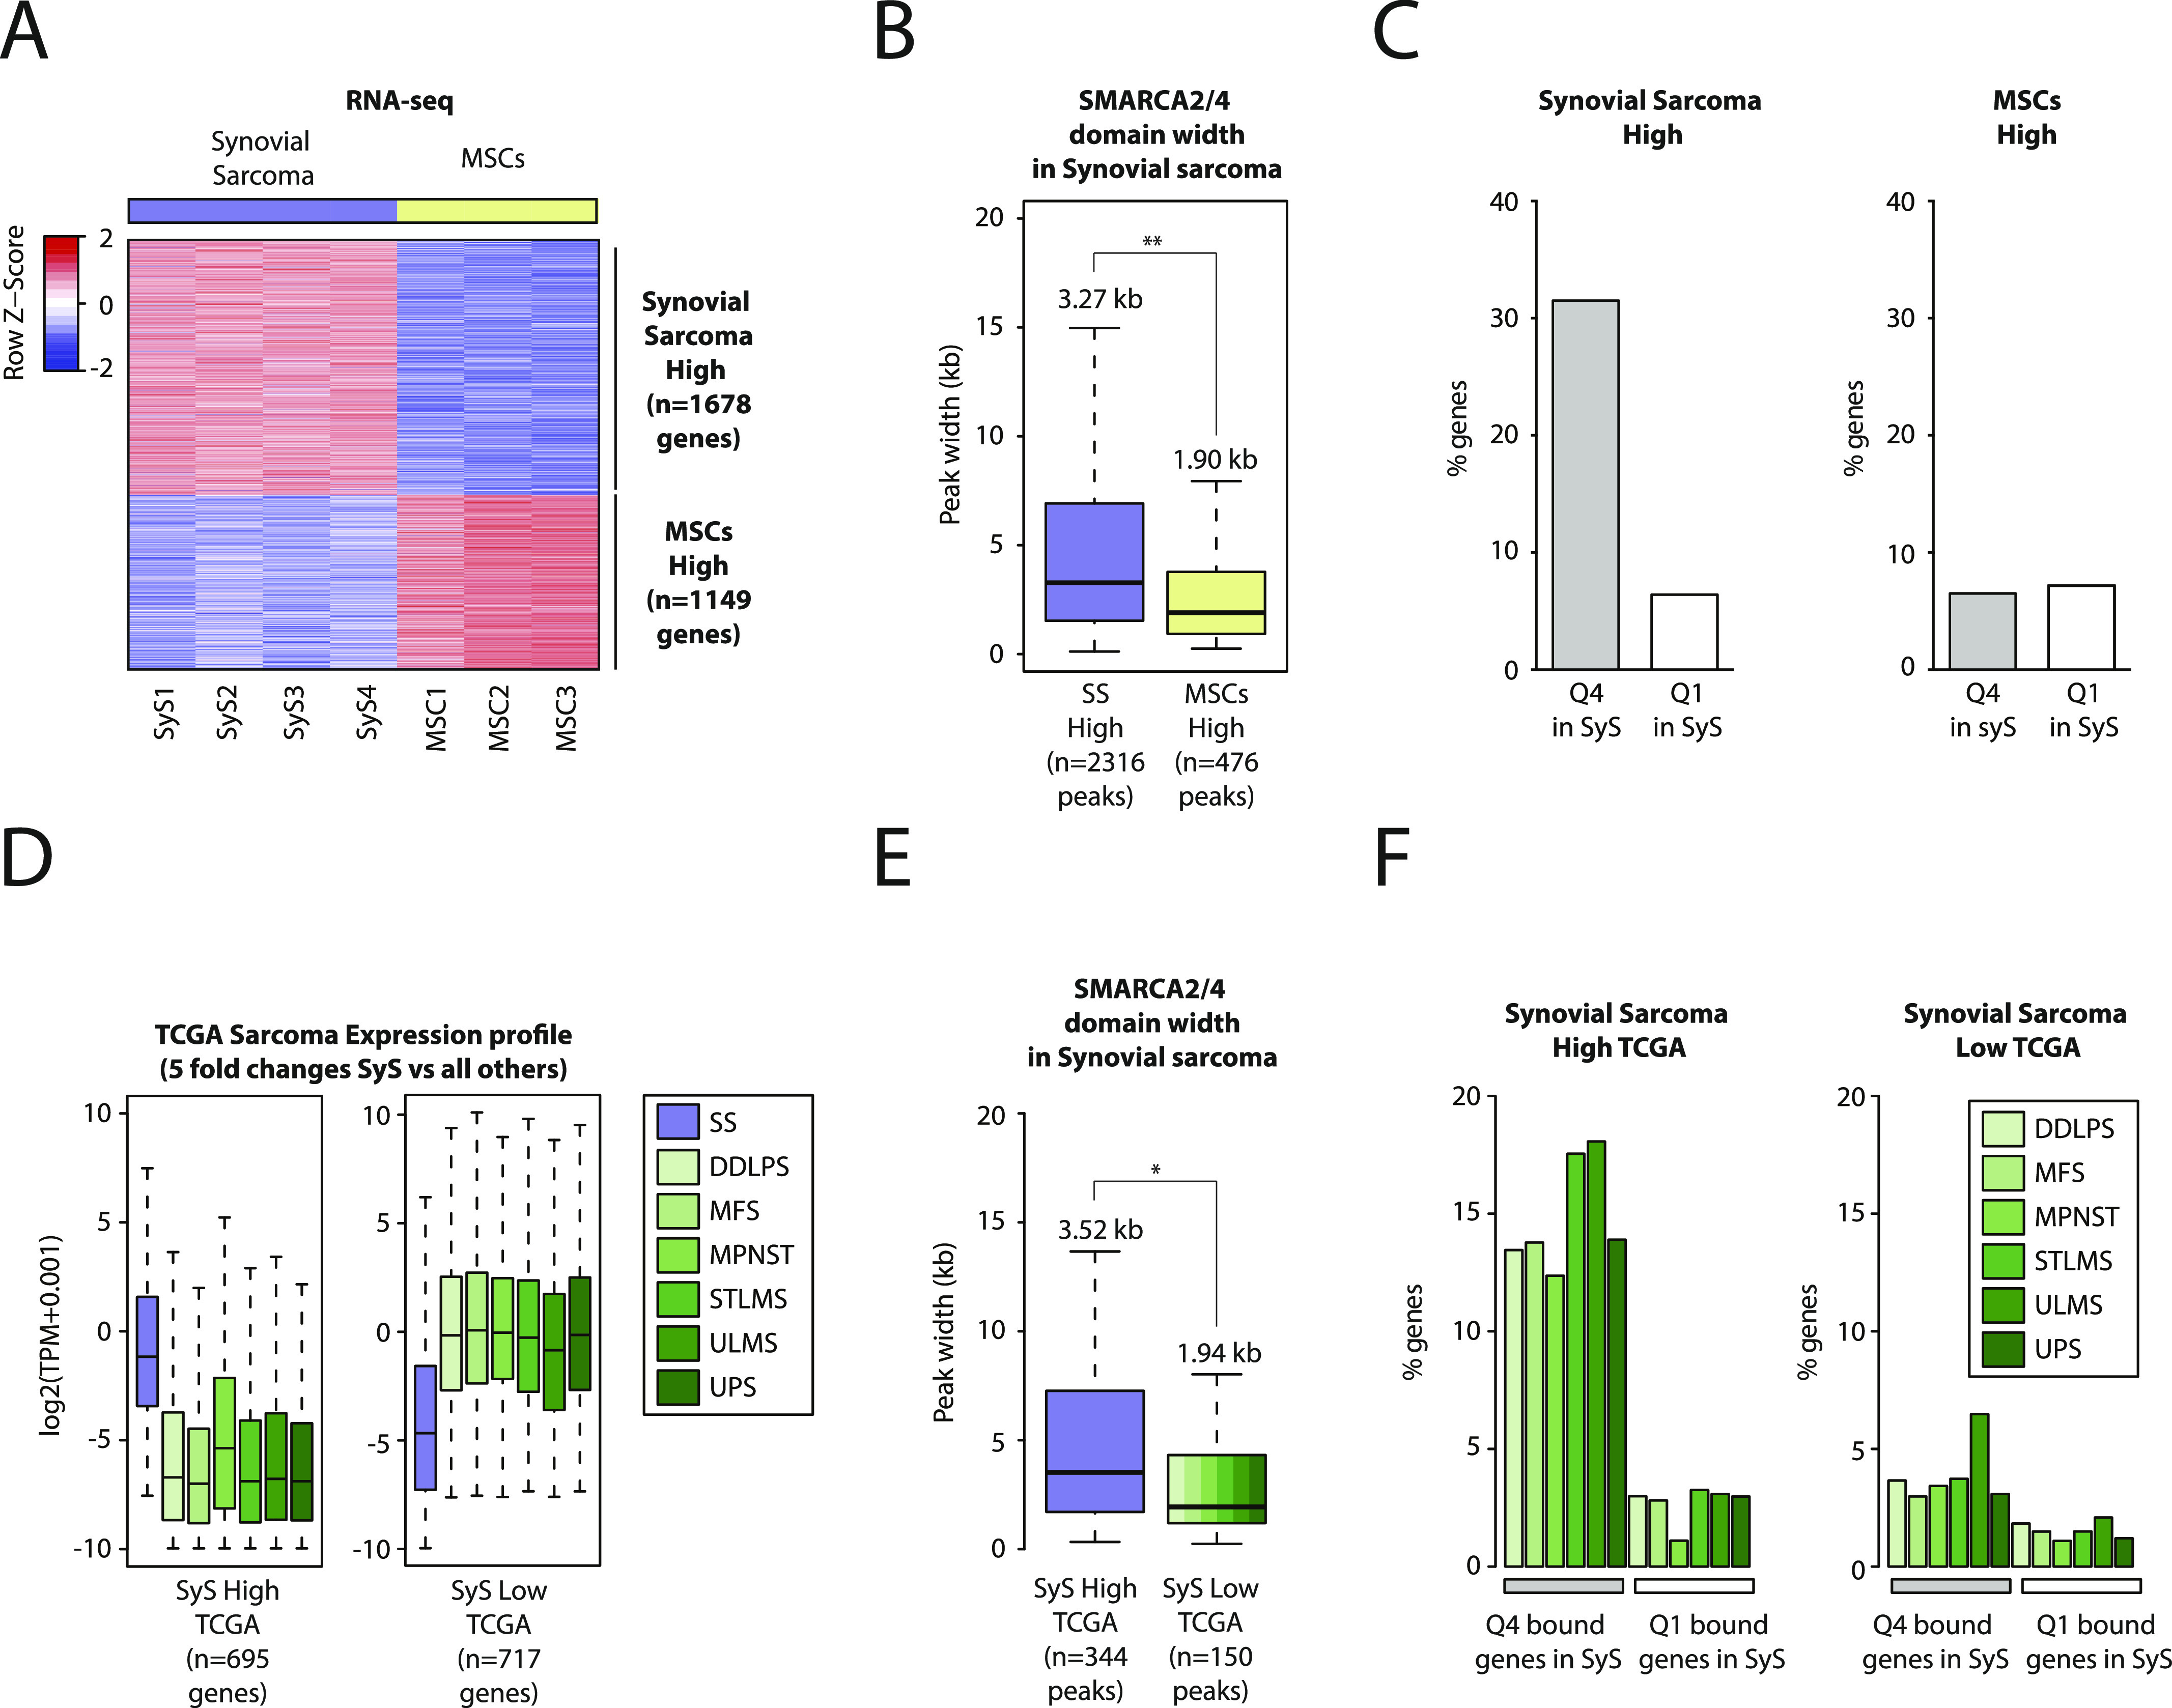
Figure 3. Broad BAF complex domains are enriched at genes specifically expressed in synovial sarcoma.

(A) Heat map showing the genes that are differentially expressed between synovial sarcoma organoids and mesenchymal stem cells (fourfold differential expression). (A, B) Boxplot showing the distribution of peak widths for BAF complex domains in synovial sarcoma 3D cultures at genes highly expressed in synovial sarcoma (purple) and at genes highly expressed in mesenchymal stem cells (yellow) identified in (A). Median peak width values are indicated. (A, C) Barplot showing the percentage of genes identified in (A) bound by either a broad (Q4) or a narrow BAF domain (Q1) in synovial sarcoma organoids. (D) Boxplot showing the genes that are differentially expressed between primary synovial sarcomas and other sarcomas from The Cancer Genome Atlas (fivefold differential expression). (D, E) Boxplot showing the peak width distribution of BAF complex domains in synovial sarcoma organoids at genes highly expressed in synovial sarcoma (purple) versus the genes highly expressed in other sarcomas (green shades) identified in (D). Median values are indicated. (F) Barplot showing the percentage of genes identified by comparing primary synovial sarcomas to other sarcomas from The Cancer Genome Atlas independently (20-fold differential expression) bound by either a broad (Q4) or a narrow BAF domain (Q1) in synovial sarcoma organoids. * indicates P-value < 0.05, ** indicates P-value < 0.01 for a Welch two-sample t test with a 95% confidence interval. See also Fig S3.
