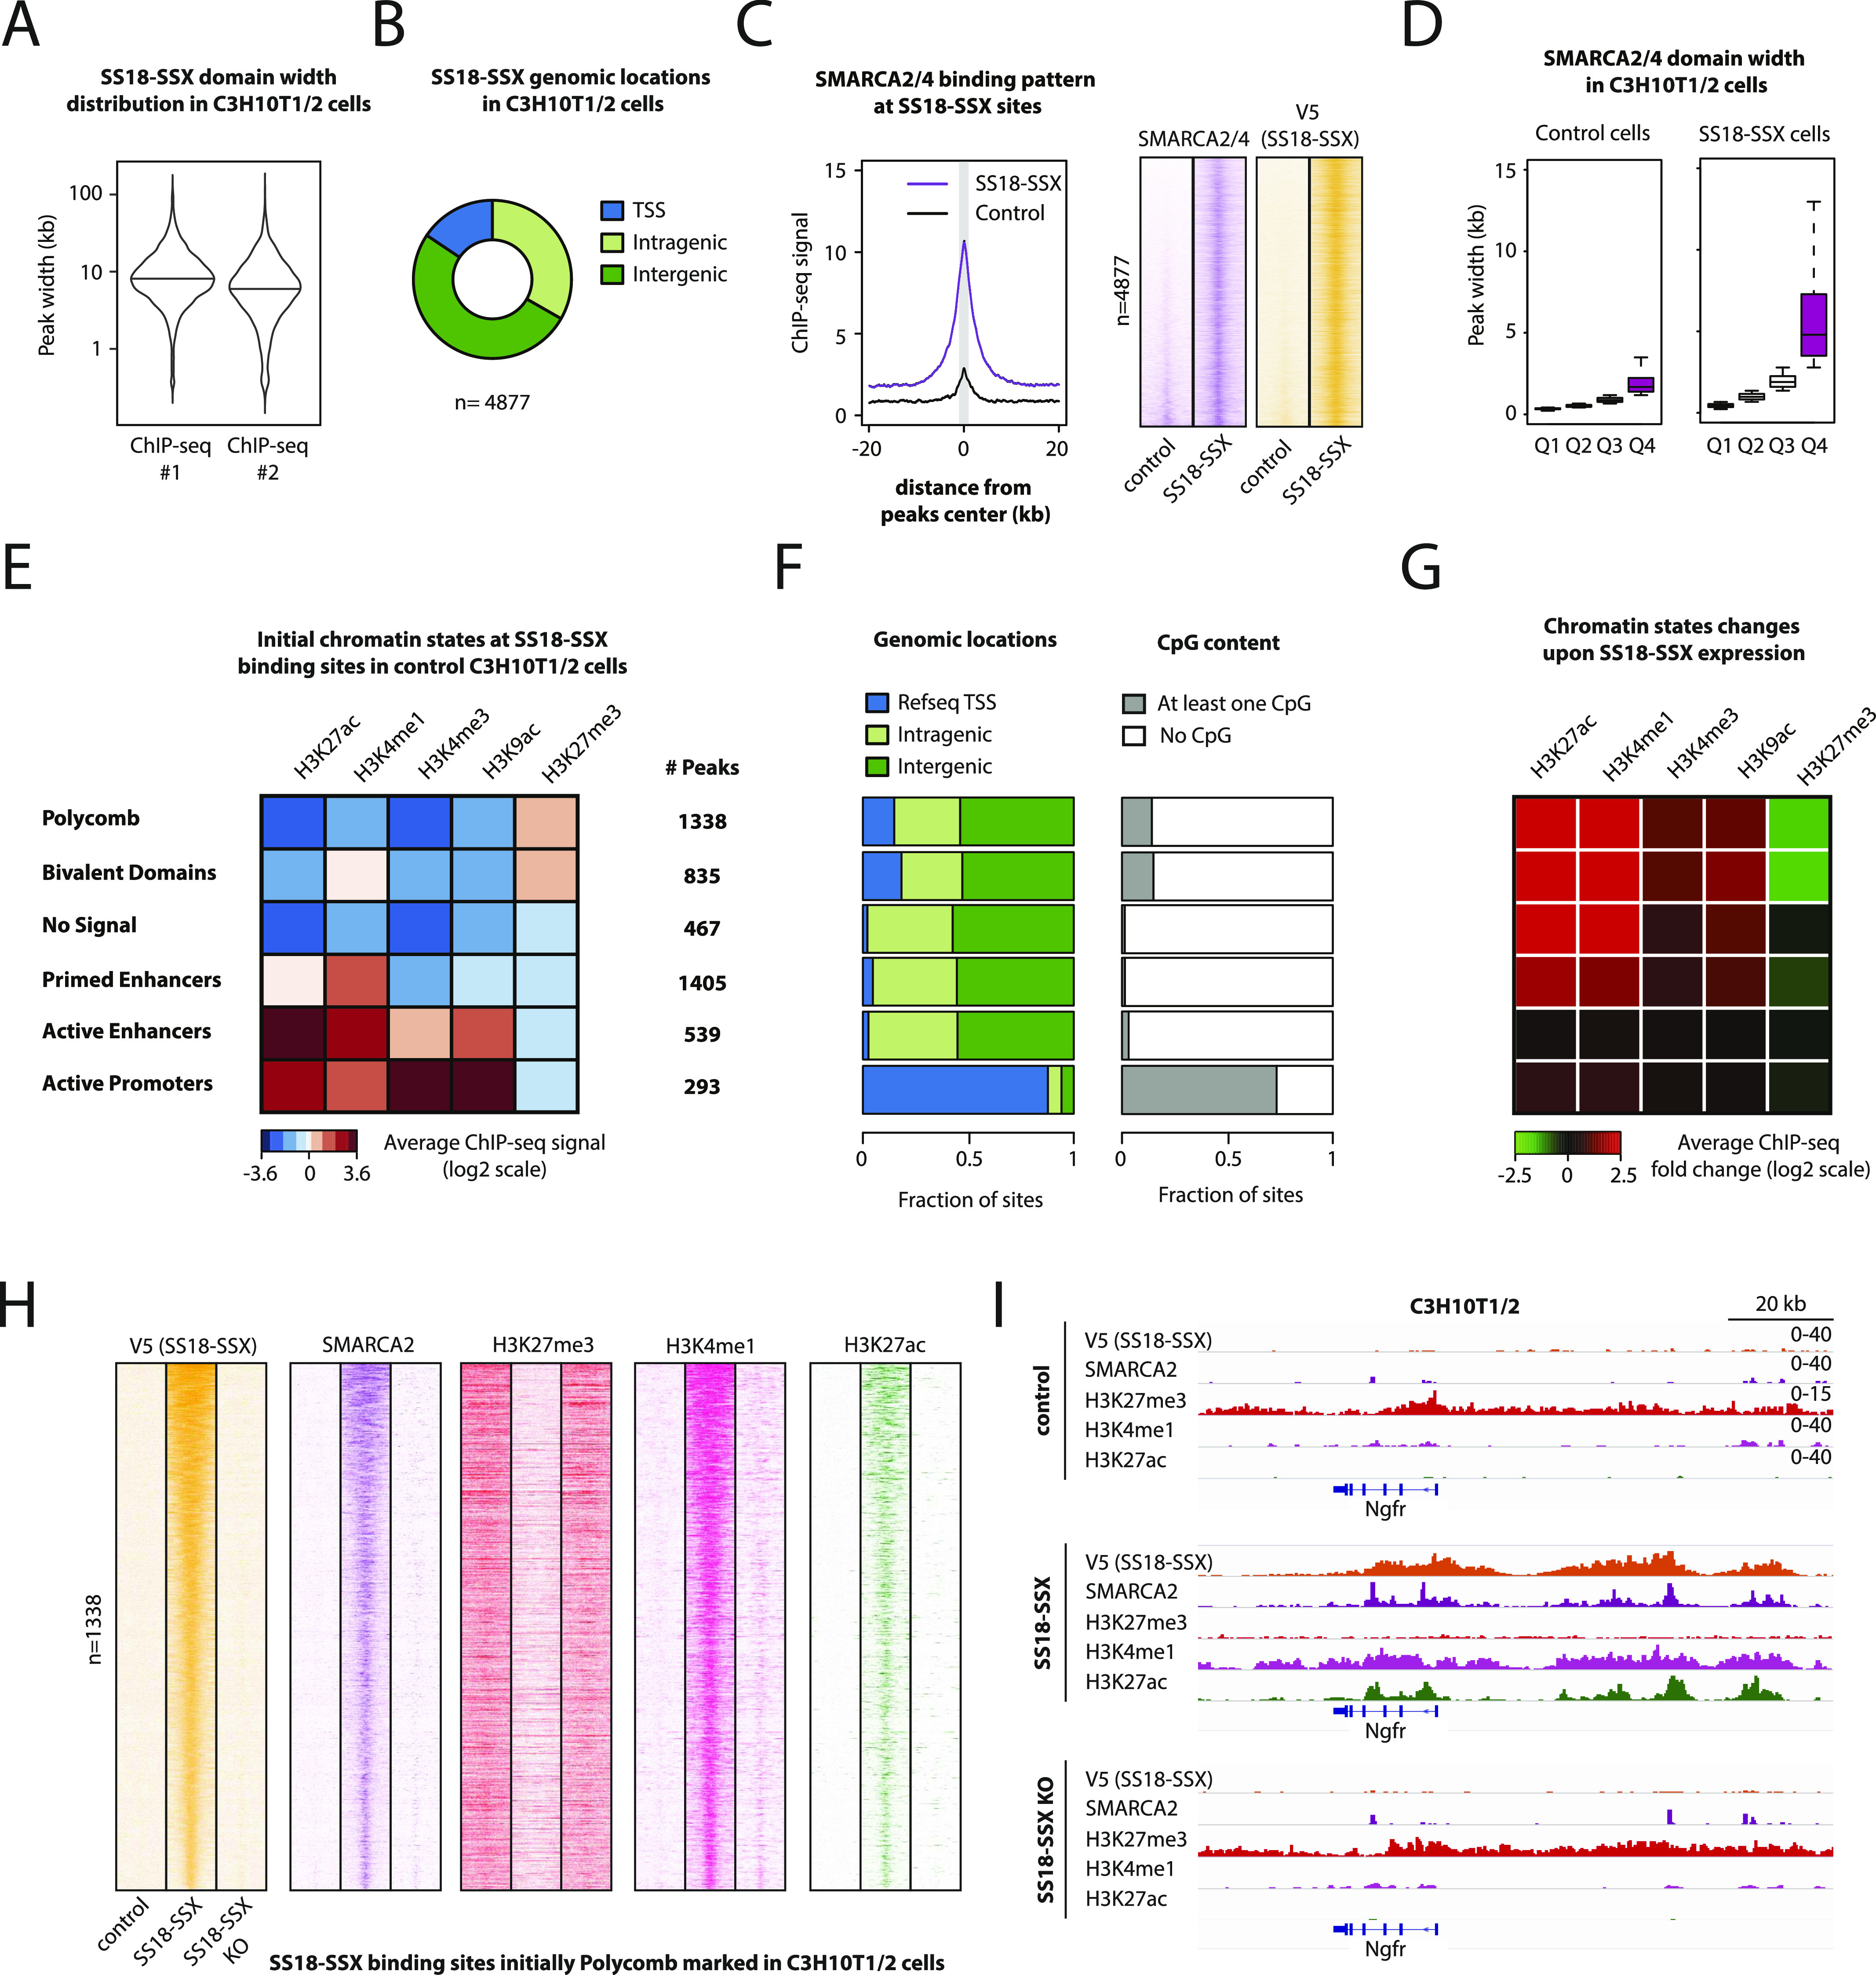
Figure 4. SS18-SSX can induce broad BAF complex domains and evict polycomb activity.

(A) Violin plot showing the overall distribution of peak widths for SS18-SSX–binding sites in C3H10T1/2 cells stably expressing the fusion protein in two independent ChIP-seq experiments. (B) Pie chart showing genomic locations of common SS18-SSX–binding sites in C3H10T1/2 cells stably expressing the fusion protein. (C) Left: Composite plot showing the average SMARCA2/4 ChIP-seq signals at SS18-SSX–binding sites in control cells (black) and cells expressing SS18-SSX (purple). Right: Heat maps showing ChIP-seq signals for SMARCA2/4 and V5 (SS18-SSX) at SS18-SSX–binding sites in control and SS18-SSX–expressing C3H10T1/2 cells. (D) Boxplot showing the distribution of peak widths for SMARCA2/4 in control (left) and SS18-SSX–expressing cells (right) per quartile. (E) Heat map showing average initial ChIP-seq signals for the indicated histone modifications in control cells at SS18-SSX–binding sites. The six indicated categories of binding sites were obtained using hierarchical clustering and manually annotated based on chromatin states. (F) Bar charts showing genomic locations (left) and annotation of CpG content (right) for each category of SS18-SSX–binding sites. (E, G) Heat map showing changes of the indicated histone modifications at each category of SS18-SSX–binding sites identified in (E). Average log2 fold changes in ChIP-seq signals are displayed. (E, H) Heat maps showing ChIP-seq signals for V5 (SS18-SSX), SMARCA2/4, H3K27me3, H3K4me1, and H3K27ac at SS18-SSX–binding sites that bore the polycomb mark H3K27me3-in control C3H10T1/2 shown in (E) before SS18-SSX expression. 20-kb windows centered on SS18-SSX–binding sites are shown. (I) Representative example of broad BAF complex domains replacing preexisting H3K27me3 polycomb domains. See also Fig S4.
