
Figure 5. SS18-SSX can induce strong gene expression changes through reversible chromatin modification mechanisms.
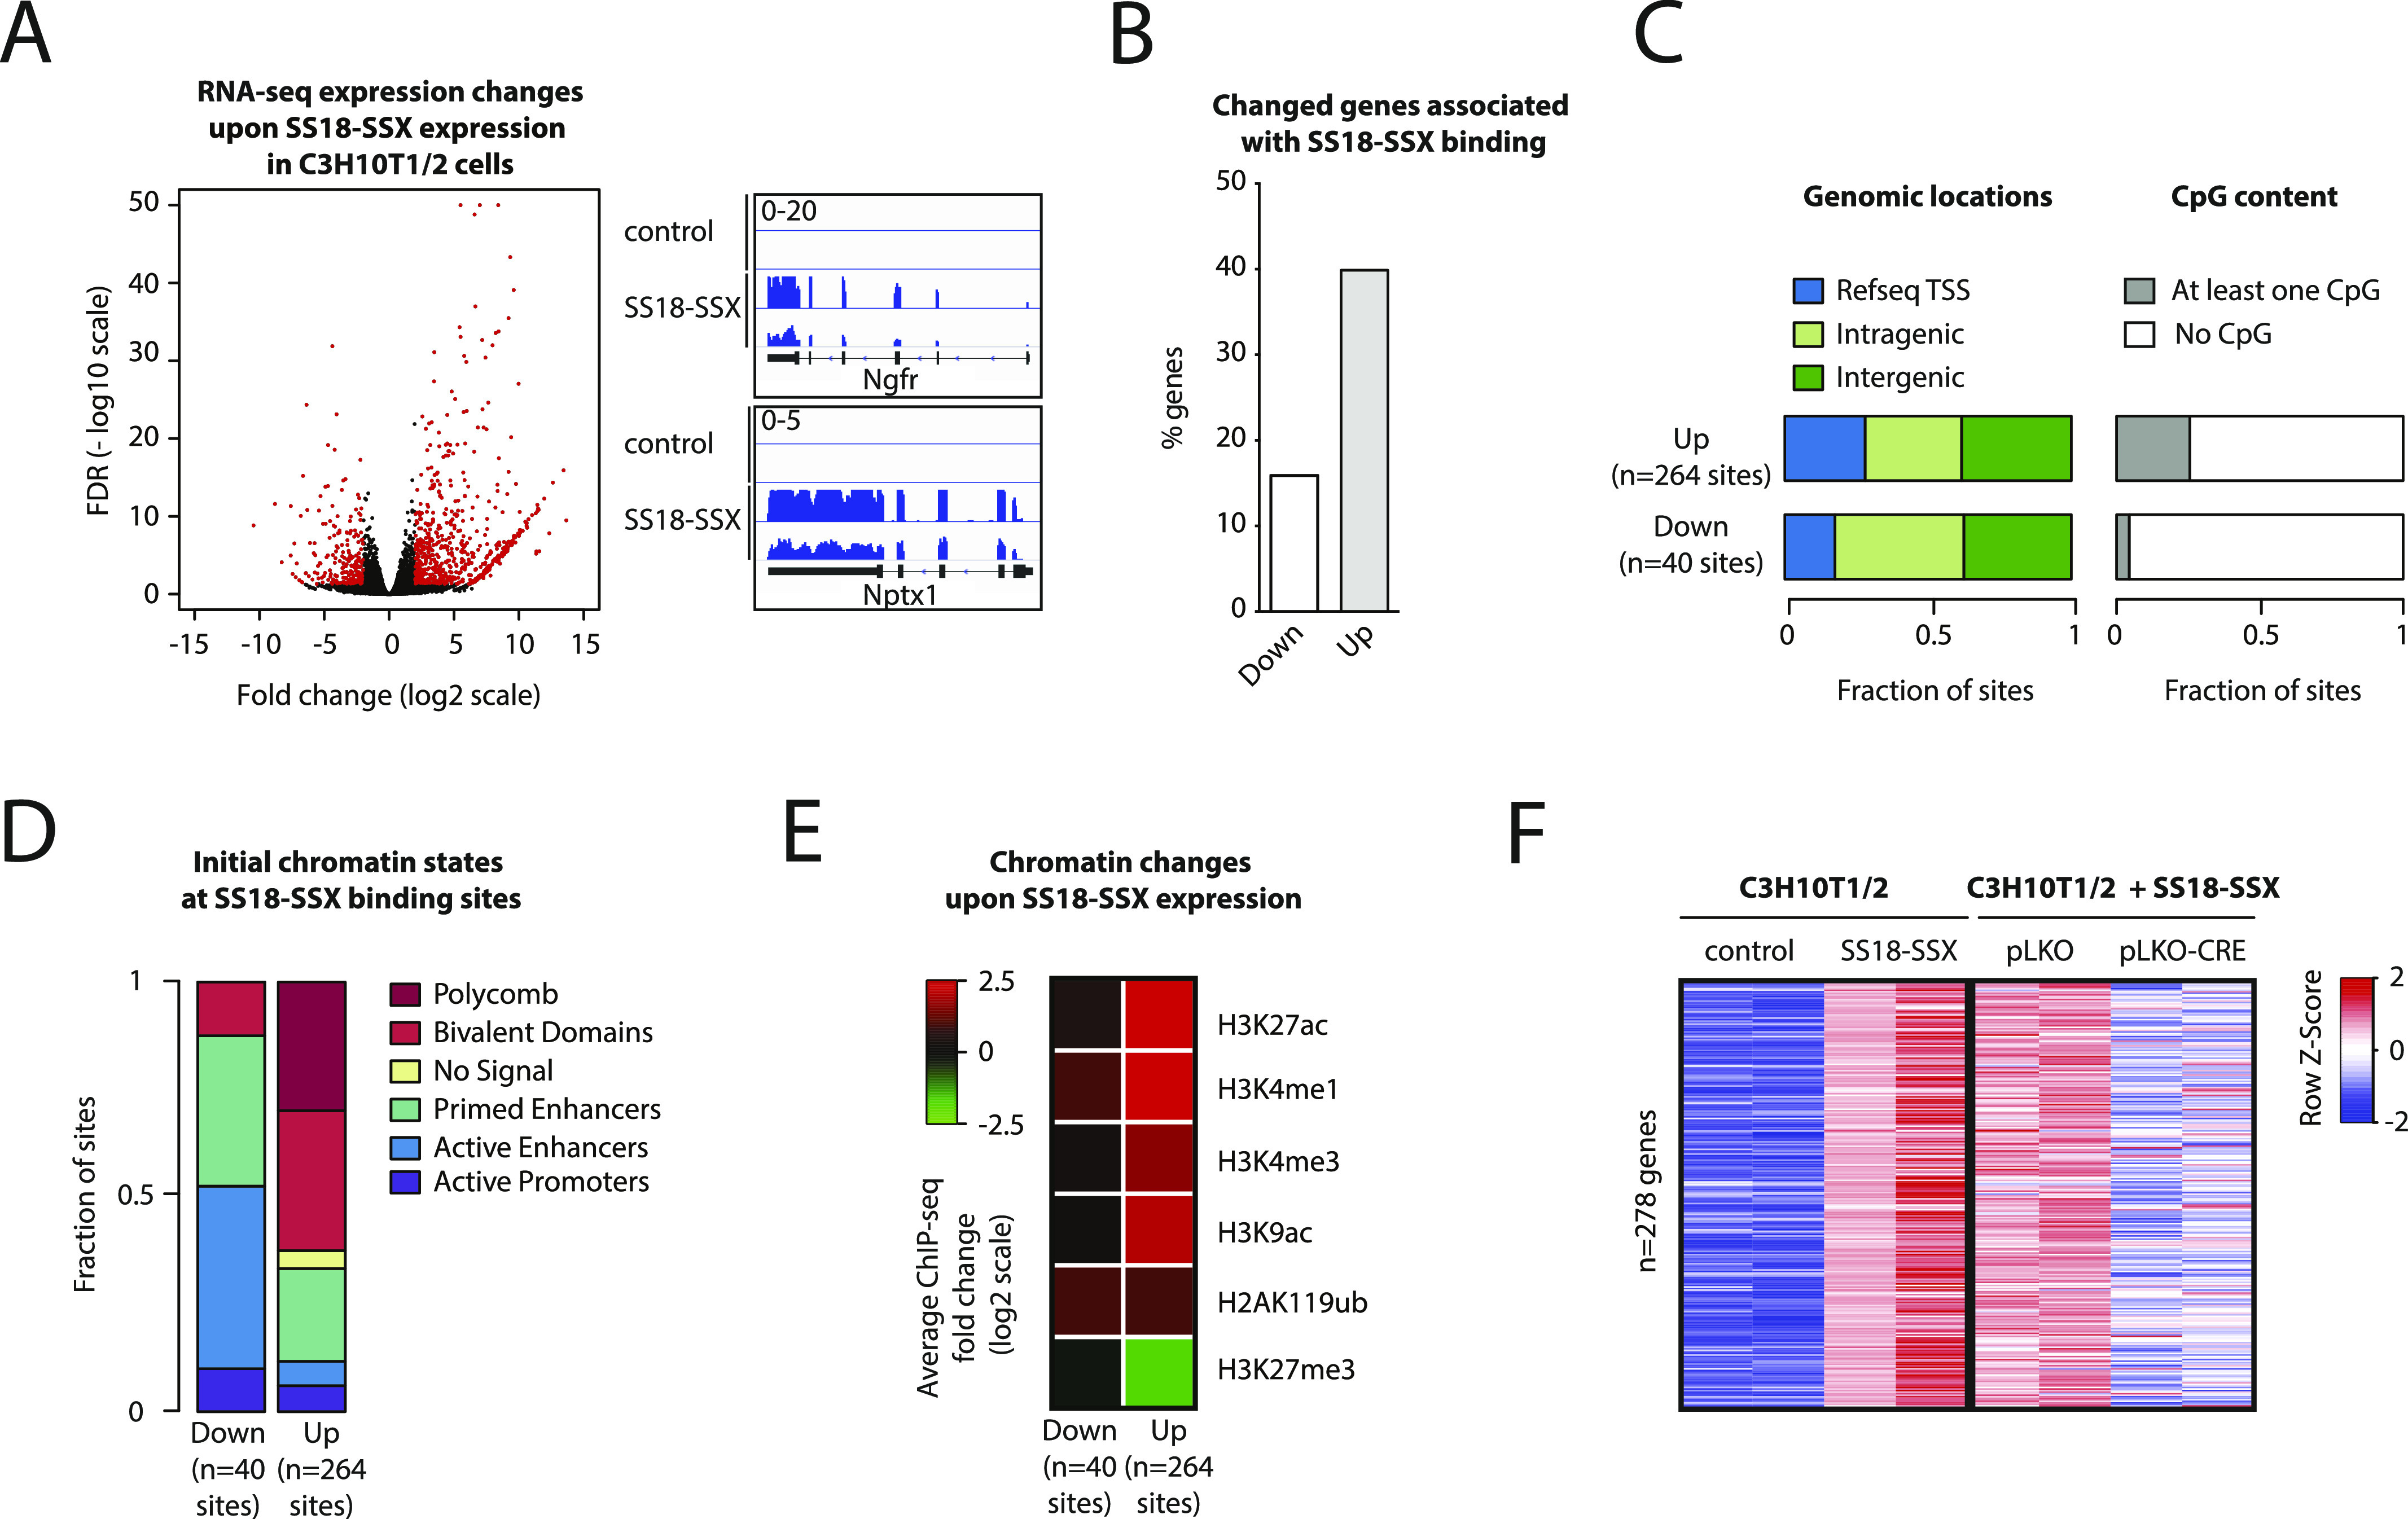
(A) Left: Volcano plot showing gene expression changes upon stable SS18-SSX expression in C3H10T1/2 cells. Red dots indicate genes differentially expressed (at least fourfold change and adjusted P-value < 0.05). Right: Representative examples of genes strongly activated upon SS18-SSX expression. (B) Barplot showing the percentage of up- and down-regulated genes upon SS18-SSX expression associated with SS18-SSX binding. (C) Bar charts showing genomic locations (left) and annotation of CpG content (right) of SS18-SSX–binding sites associated with up- and down-regulated genes. (D) Bar chart showing the distribution of initial chromatin states as defined in Fig 4E at SS18-SSX–binding sites associated with up- and down-regulated genes. (E) Heat map showing ChIP-seq changes for the indicated histone modifications at SS18-SSX–binding sites associated with up- and down-regulated genes. (F) Heat map showing gene expression changes upon SS18-SSX expression in C3H10T1/2 cells (left) and upon SS18-SSX removal (right). See also Figs S5 and S6.