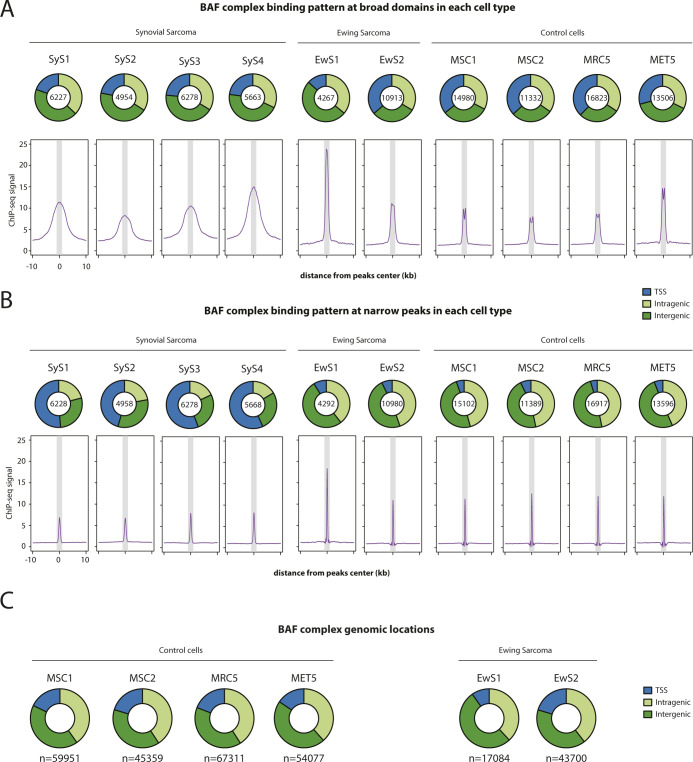
Figure S1. Related to Fig 1. Comparison of narrow and broad BAF complex–binding sites.
(A, B) Pie charts showing genomic locations (top) and composite plots show SMARCA2/4 ChIP-seq signal distribution (bottom) at broad domains (A, top quartile) and narrow peaks (B, bottom quartile) identified in each cell type. Synovial sarcoma patient-derived tumor organoids are shown on the left and control cells on the right. 20-kb windows centered on SMARCA2/4–binding sites are shown. The gray area shows a 2-kb window. (C) Pie charts showing genomic locations of SMARCA2/4–binding sites in control cells and Ewing sarcoma patient-derived tumor organoids.

