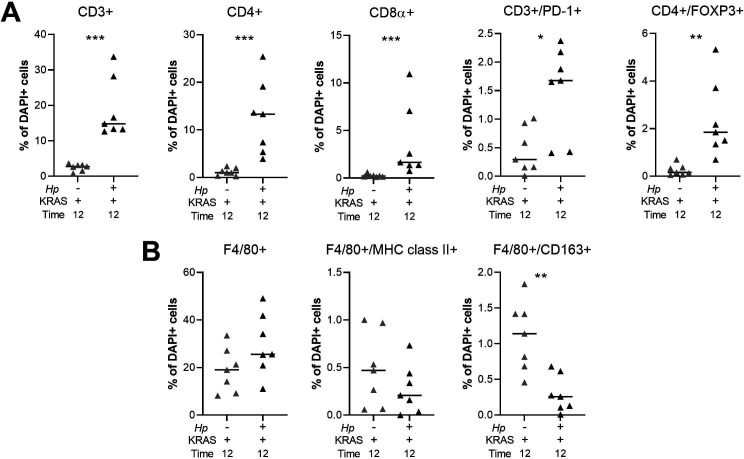
Figure S6. Quantitation of multiplex IHC confirms robust T cell infiltration and altered macrophage polarization in Hp+/KRAS+ mice.
(A, B) HALO software was used to detect and quantify the indicated T cell (A) and F4/80+ (B) subsets. Results are expressed as the percentage of all DAPI+ cells within a given image. Two images per mouse were assessed and the average result for each marker is plotted. Bars indicate median values. Statistically significant comparisons are indicated by: *P < 0.05, **P < 0.01, ***P < 0.001, Mann–Whitney U test.

