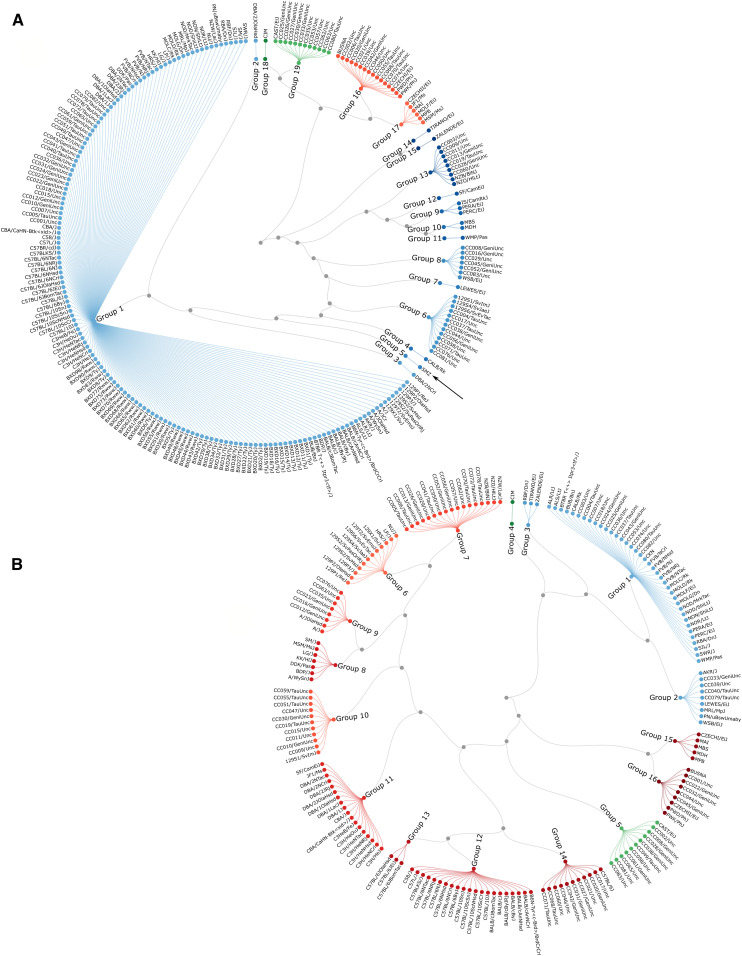
Figure 6.
Haplotype diversities. Haplotype diversities of the mitochondria (A) and chromosome Y (B). The trees are built based on the variation present in MiniMUGA and may not represent the real phylogenetic relationships. Colors denote the subspecies-specific origin of the haplotype in question: shades of blue represent M. m. domesticus haplotypes; shades of red represent M. m. musculus haplotypes; and shades of green represent M. m. castaneus haplotypes. The arrow in panel (A) identifies a M. spretus strain with a M. m. domesticus mitochondria haplotype. MUGA, Mouse Universal Genotyping Array.

