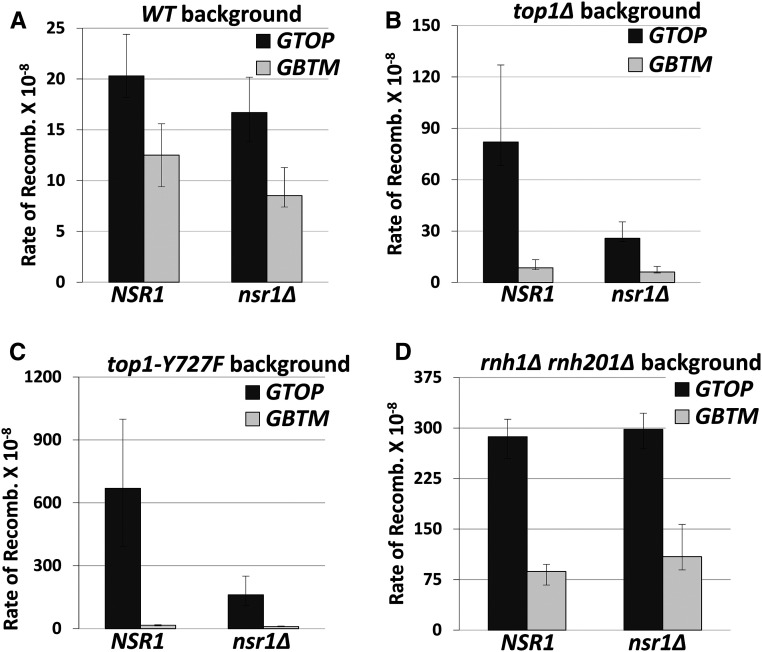
Figure 1.
The rates of G4-associated recombination in nsr1∆ strains. Guanine-runs are on the nontranscribed, top strand in a single-stranded state in pTET-lys2-GTOP cassette and on the transcribed strand annealed to the nascent RNA in the pTET-lys2–GBTM cassette. All graphs show the rates of recombination (×10−8). Error bars indicate 95% confidence intervals. Two rates are considered statistically different when the confidence intervals do not overlap. The rates, numbers of cultures used in fluctuation analyses, and 95% confidence intervals are listed in Table S2. (A) Recombination rates in WT backgrounds. (B) Recombination rates in top1∆ backgrounds. (C) Recombination rates in top1Y727F backgrounds. (D) Recombination rates in rnh1∆ rnh201∆ backgrounds.

