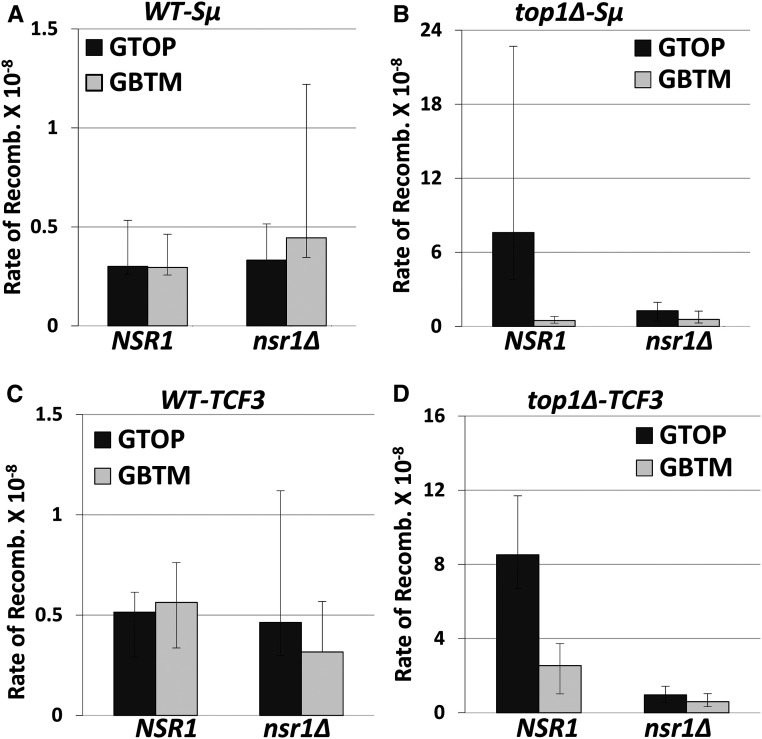
Figure 2.
Rates of gross chromosomal rearrangement (GCR) in nsr1∆ strains. All graphs show the rates of 5-FOAr/CANr or GCRs (×10−8). The rates of GCRs occurring at CHR5 containing the pTET-lys2-GTOP or -GBTM cassette are determined by the method of median. 95% Confidence intervals are indicated by the error bars. Two rates are considered statistically different when the confidence intervals do not overlap. GCR rates, numbers of cultures used in fluctuation analyses, and the 95% confidence intervals are listed in Table S4. GCR rates in strains with the reporter cassette containing the Sμ-G4 in (A) WT backgrounds and (B) top1∆ backgrounds. GCR rates in strains with the reporter cassette containing TCF3-G4 in (C) WT backgrounds and (D) top1∆ backgrounds.

