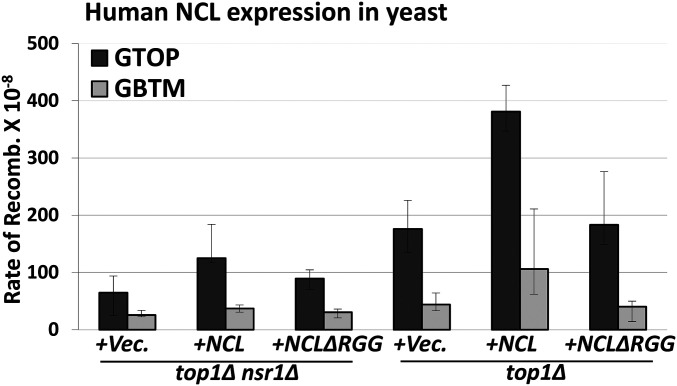
Figure 4.
Overexpression of Nsr1 or hNCL. The top1∆ nsr1∆ or top1∆ yeast cells were transformed with empty vector (+Vec), hNCL-expression plasmid (+NCL) and hNCL-∆RGG followed by fluctuation analysis to determine the rates of recombination. All graphs show the rates of recombination (×10−8). Error bars indicate 95% confidence intervals. Two rates are considered statistically different when the confidence intervals do not overlap. The rates, numbers of cultures used in fluctuation analyses, and 95% confidence intervals are listed in Table S7.

