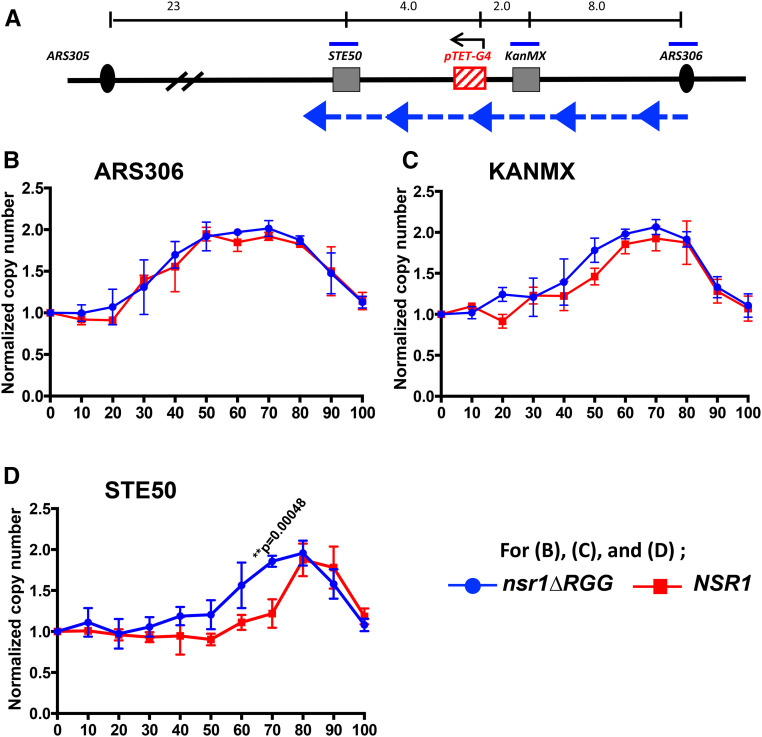
Figure 6.
DNA replication timings and copy number changes determined by ddPCR. (A) A schematic drawing of the regions proximal to the pTET-lys2-GTOP cassette on yeast chromosome III. The locations of primers used in ddPCR are indicated by blue bars. The black arrow over pTET-G4 indicates the direction of transcription. Large blue arrow heads with dashed blue line indicate the direction of replication fork movement. For the sequences of the primers, see Table S1. The distance indicated above in kilobases are estimates and not to scale. (B–D) For top∆ and top1∆ nsr1∆RGG strains, DNA samples analyzed by ddPCR were extracted at the indicated time points (minutes after the release from α-factor). For calculating the copy number, each time point value of “ARS306,” “KanMX”, and “STE50” loci was normalized to time 0 value of the “ARS306” locus. And for “KanMX” and “STE50” loci, they were further normalized to the “KanMX” at time 0 and “STE50” at time 0, respectively. Data from at least three independent experiments was used to calculate mean and standard deviations (indicated by error bars). P-values were calculated using Student’s t-test. All P-values <0.005 are indicated. Normalized copy number of (B) “ARS306”, (C) “KanMX”, and (D) “STE50” loci.

