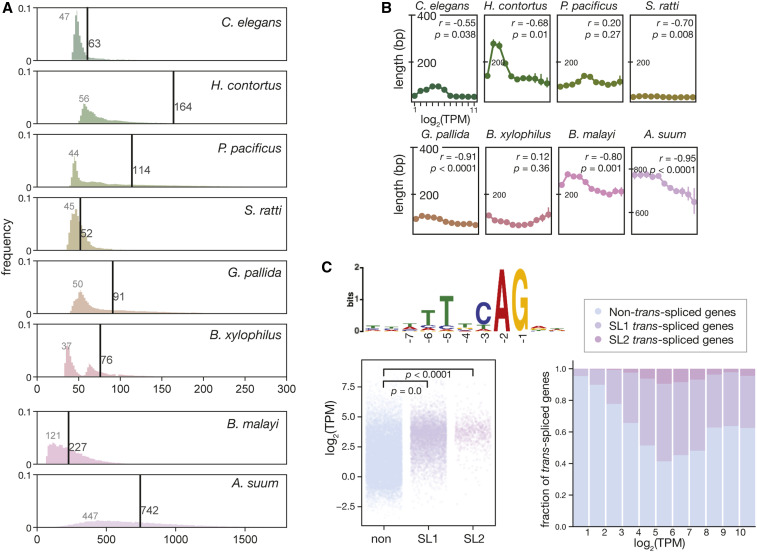
Figure 2.
Global intron length distribution in diverse nematodes. (A) The intron length distribution of eight nematode species. Vertical lines indicate the median lengths of introns of each species, while the numbers in gray indicate the modes of intron lengths (bp). (B) Median intron length as a function of the gene expression. The protein-coding genes are binned by expression level from low to high with a log2 scale into 11 bins. (C) Elevated expression level of SL1-operated genes. Consensus sequence of the SL1 trans-splice sites in P. pacificus (top). SL1- and SL2-spliced genes have a higher expression level than those that are not trans-spliced (left). The proportion of trans-spliced genes is positively associated with expression level (right). SL1, spliced leader 1; TPM, transcripts per kilobase million.

